

Just in case you are new to this blog (which most probably you will be :)), you can read the first part of this series here Link
Debt Fund Returns
=
Interest from underlying debt securities
+
Price changes in the market value of underlying debt securities
(based on interest rate changes)
or in other words..
Debt Fund Returns everyday = (Yield to maturity/365) + (-1*Modified duration*
% change in YTM)
8 factor framework for investing in any debt mutual fund
- Yield to Maturity – Expense Ratio
- Credit Quality: % of government, AAA and AA rated bonds
- Modified Duration
- Average Maturity
- Size
- Exit Load
- Historical NAV movement graph
- Returns
1.Yield to Maturity – Expense ratio
This will approximately be equal to the returns that you can expect from the fund in a year if there is no change in the interest rates (read as yield to maturity)
2.Credit Quality: % of government and AAA rated bonds
This is to check if the fund is taking any credit risk. The higher the % of AAA and government securities in the portfolio of debt mutual fund, lower is the credit risk i.e probability of default or downgrade in the fund. Even AA papers are fine to a certain extent.
A debt fund which is taking credit risk will have a higher yield to maturity (because when you are lending to a lower rated borrower you would demand a higher interest rate). So the Yield to maturity level compared to other funds can also be used as a proxy to find out if the fund is taking credit risk.
I personally prefer funds which do not take credit risk and have a high % portfolio allocation in either government bonds or AAA securities.
3. Modified Duration
Check this number to figure out if the fund is undertaking any interest rate risk. Higher the modified duration higher is the interest rate risk i.e sensitivity to interest rate changes. Also check if the modified duration will be actively managed i.e will the fund manager regularly adjust the modified duration based on his interest rate view. If the fund is actively managed then the fund manager will typically try to increase duration if he expects interest rates to fall and vice versa.
4.Average Maturity
This no in my personal opinion is not too important but provides you a sense of tenor of the debt securities that the fund holds. The lower the tenor the lower is the interest rate risk. Few also interpret this number (some also use modified duration) as an approximate indicator of the time for which an investor must typically be invested in the fund. It is also used to ascertain the category of the fund. (Liquid, Ultra Short Term, Short Term, Income – in increasing order of average maturity)
5.Size
Fund size is important as flows are normally of a significant size (because corporate companies are major investors in debt funds). Further, trading in the debt market requires huge minimum lots. A reasonably sized debt fund helps the fund manager to meet redemptions (read as investors taking money out of the fund) without resorting to distress sales and also provides sufficient size to trade in debt securities. Personally, I would be comfortable with a fund that has a size more than INR 500 cr at least.
6.Exit Load
An Exit Load is the fee charged by mutual funds if an investor wishes to withdraw his investment in mutual fund within a specified period from that fund. This charge is calculated as a percentage of the NAV and not on the amount you invest. The lower the exit load period the better!!
7.Historical NAV movement graph
Provides you a sense of the historical volatility in the returns of the fund.
8. Returns
Also just have a look at the fund’s historical returns and its performance vis-a-vis the peer group. We typically need a fund which has performed over a long period and most importantly has done it consistently.
Enough of theory, let’s take the example of a few funds and apply the framework..
I will be using value research online (link) and morningstar website (link) for all my analysis
Example 1: HDFC Liquid Fund – Growth
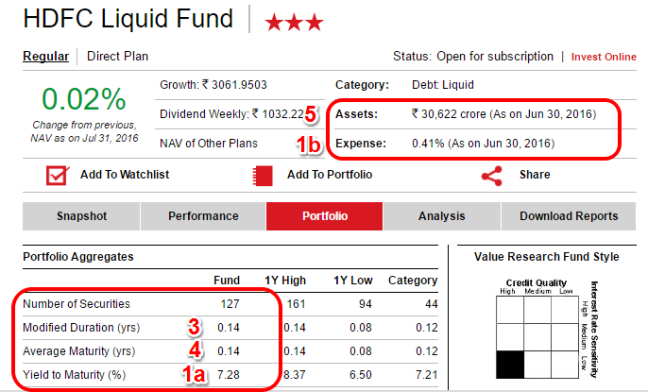
1.YTM – Expense Ratio
= 7.28%-0.41% = 6.87%
So 6.87% is the annual return to be expected from the fund if the YTM remains the same. Expense ratio seems reasonable.
Daily stable return portion = 6.87%/365 =0.019% every day gets added to the NAV
i.e for every Rs 1 lakh invested Rs 19 will get added everyday
2.Credit Quality
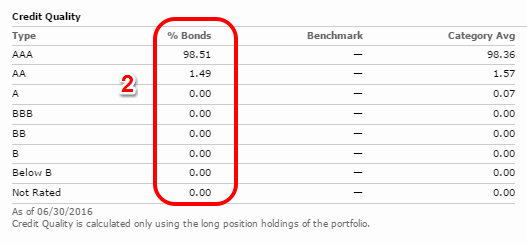
As seen above ~98.5% of the underlying debt securities are in AAA bond securities. Hence the fund is not taking any credit risk to improve performance.
But, the fact that the fund is not taking any credit risk right now does not mean that it won’t take any credit risk in the future. So let us also check its historical credit quality for getting a better idea.
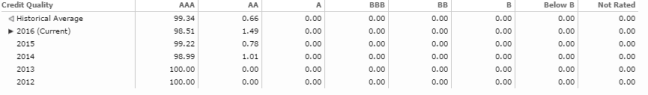
As seen above the fund has historically maintained above 98% in AAA bond securities for the last 5 years and therefore we can reasonably conclude that the fund does not take credit risk.
3. Modified Duration
The modified duration is 0.14 years. This implies that if the interest rates (read as YTM) goes down by 1% (i.e from 7.28% to 6.28%) then the NAV will increase by 0.14% and if instead the interest rates goes up by 1% then the NAV will reduce by 0.14%. Thus as seen, the impact due to interest rate changes are minimal as the fund has low modified duration.This also implies that the fund has not undertaken any interest rate risk to improve returns.
4.Average Maturity
The average maturity is 0.14 i.e 0.14*365 which is around 51 days. This will also help us ascertain the category of fund (but let us leave that for the next post).
5.Size
The size is at Rs 30,622 cr and is comfortably above our threshold of Rs 500 cr.
6.Exit Load
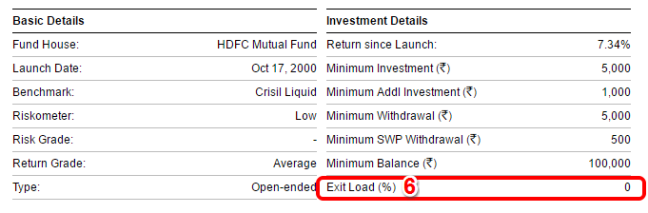
There is no exit load for the fund which is good.
7.Historical NAV Graph
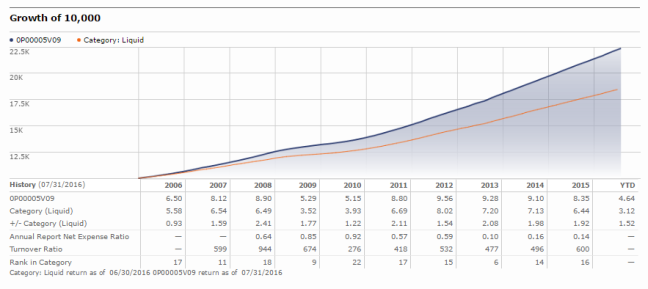
From our analysis so far, we know that the fund does not take credit risk and interest rate risk. Hence the returns must be pretty stable as it is only driven by the interest income which is the YTM (Yield to maturity) component. We can confirm that from the above 10 year NAV movement chart of the fund which shows extremely smooth movement in NAVs.
8.Historical Returns
You can check them from the above chart. As seen, the fund has consistently outperformed its category average in all the years.
Final thoughts:
Thus if I were to invest in the fund I will expect approximately around 6.87% returns from the fund provided interest rates stay around the same levels. If interest rates go down then my returns will also go down (as the YTM component goes down and so does your daily return i.e YTM/365) and if instead the interest rates go up then my returns will also correspondingly improve. (Note: Since modified duration is very low I am not taking into account the underlying debt security price changes due to interest rate movement.)
Example 2:
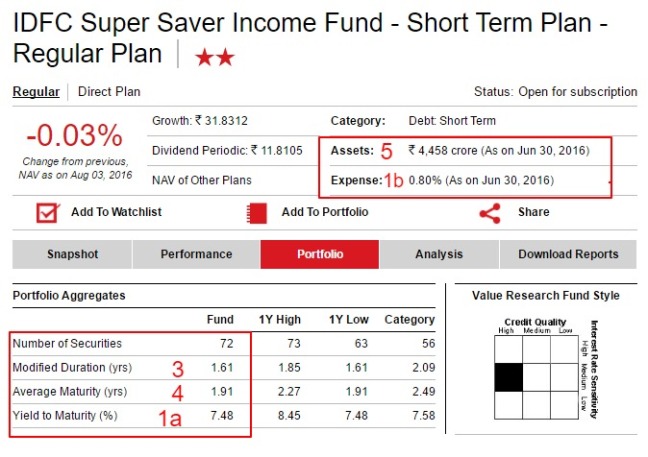 1.YTM – Expense Ratio
= 7.48%-0.80% = 6.68%
The expense at 0.80% seems to be on the higher end (must check with other funds in the category on how much are they charging)
So 6.68% is the annual return to be expected from the fund if the YTM remains the same.
Daily stable return portion = 6.68%/365 =0.18% every day gets added to the NAV
i.e for every Rs 1 lakh invested approximately Rs 18.3 will get added everyday
2.Credit Quality
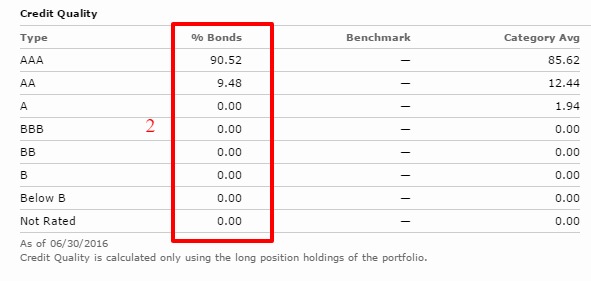
As seen above ~90.5% of the underlying debt securities are in AAA bond securities and remaining in AA bond securities (slightly lower than AAA in terms of quality but still acceptable). Hence the fund is not taking any credit risk to improve performance.
But, the fact that the fund is not taking any credit risk right now does not mean that it won’t take any credit risk in the future. So let us also check its historical credit quality for getting a better idea.
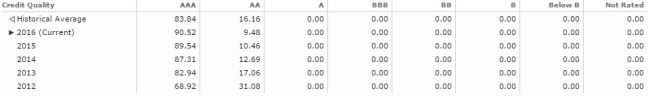
The fund has historically stuck to AAA and AA bond securities for the last 5 years and therefore we can reasonably conclude that the fund does not take credit risk.
3. Modified Duration
The modified duration is 1.61 years. This implies that if the interest rates (read as YTM) goes down by 1% (i.e from 7.48% to 6.48%) then the NAV will increase by 1.61% and if instead the interest rates goes up by 1% then the NAV will reduce by 1.61%. Thus as seen, the impact due to interest rate changes on the NAV while not significantly high is still there, as the fund has consciously included some modified duration.This also implies that the fund has consciously undertaken moderate interest rate risk to improve returns.
4.Average Maturity
The average maturity for the underlying debt securities is 1.91 years
5.Size
The size is at Rs 4,458 cr and is comfortably above our threshold of Rs 500 cr.
6.Exit Load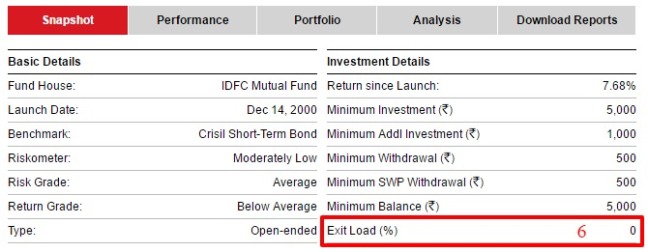 There is no exit load for the fund which is good.
7.Historical NAV Graph
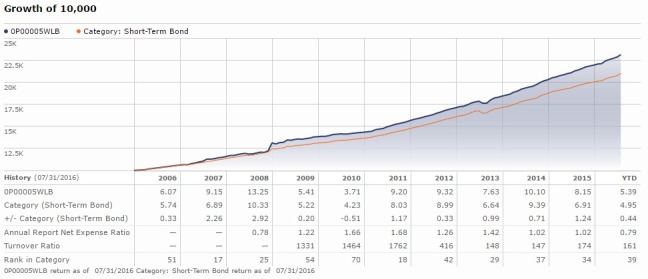
From our analysis so far, we know that the fund does not take credit risk but however takes some bit of interest rate risk. Hence the returns must have some intermittent volatility based on the NAV impact due to interest rate movements which adds on to the stable interest income component. We can confirm that from the above 10 year NAV movement chart of the fund which shows mostly smooth but intermittent volatility in NAVs.
8.Historical Returns
You can check them from the above chart. As seen, the fund has consistently outperformed its category average in all the years except for 2010.
Final thoughts:
Thus if I were to invest in the fund I will expect approximately around 6.7% returns from the fund if interest rates stay around the same levels. My returns will be higher than 6.7% if interest rates go down.If they go down by 1% since my modified duration is 1.61 years my NAV returns will spike up by 1.61%. So in this case my overall returns will be around 6.7%+1.6%= 8.3%. So if your expectation is for the interest rates to go down, then this type of a fund makes a lot of sense. But what is the catch? Yup you guessed it right. If interest rates move up by 1%, then your returns will become 6.7%-1.6%=5.1%.
So we have basically figured out how to interpret returns from a debt fund. You can try applying the same framework for different debt funds on your own.
In our next post, we will understand different debt fund categories, when to use them and how to select funds.
If you have any queries do let me know via the comments or mail. Hope to keep learning from all of you and as always happy investing folks 🙂
Disclaimer: No content on this blog should be construed to be investment advice. You should consult a qualified financial advisor prior to making any actual investment or trading decisions. All information is a point of view, and is for educational and informational use only. The author accepts no liability for any interpretation of articles or comments on this blog being used for actual investments

well written article-even the beginners can understand. A small correction- in the first example , HDFC Liquid fund, the expense ratio is 0.41% , so the yield should be 7.28-0.41= 6.87%. Considering tax impact, why is it better compared to FD ?
LikeLike
Good to see you back Mr Ravindran. Thanks a ton for pointing out the mistake and I have corrected the error.
HDFC Liquid fund belongs to a category of debt fund called liquid funds. Essentially these funds take very low credit and interest rate risk and invest in debt securities that mature within 90 days. I like to look at this category as a substitute for our savings bank account. These funds can be used for parking money which you need within 3 months. The primary advantage is the convenience and liquidity (you can pull it out any time). So I generally move my savings from my salary first into a liquid fund and slowly figure out where to invest or spend.
Now there is no tax advantage vis-a-vis a fixed deposit and there is nothing wrong in using an FD instead as long as your bank allows you to take it out anytime without penalty.
As expected, the rates are more or less in line with FD rates
These are the rates for ICICI Bank
7 days to 14 days 4.00-4.50
15 days to 29 days 4.25-4.75
30 days to 45 days 5.50-6.00
46 days to 60 days 6.50-7.00
61 days to 90 days 6.75-7.25
Source: http://www.icicibank.com/interest-rates.page
But honestly, in this category liquidity and “return of capital” is the priority over “return on capital”. And for the amounts that most of us deal with it really wouldn’t make a big difference.
So do choose an FD or Debt fund based on your convenience and comfort 🙂
Thanks once again for dropping by Mr Ravindran. Happy investing 🙂
LikeLike
Hi Arun
Why do you say there is no tax advantage over FD? If one holds the investment in liquid fund over 3 years, he gets taxed only on the indexed returns in which case he may better off than investing in FD by substantial amount.
Thanks
LikeLike
Very well presented Arun! Keep going!
Cheers
Govind
LikeLiked by 1 person
Thanks a ton Govind 🙂
LikeLike
Nicely explained…
LikeLike
Thanks
LikeLike
Which debt fund for coming 9 months as bond yield lowest now and rate cut expected by DEC.in India and rate hike in Usa. 2 countreis different situations. Pl suggest.
LikeLike
Hello Arun,
A very intuitive explanation indeed except one piece which i am trying get my around and i need your help to clarify this –
Under “Final Thoughts” in Example 2, you have mentioned, quote “If they go down by 1% since my modified duration is 1.61 years my NAV returns will spike up by 1.61%. So in this case my overall returns will be around 6.7%+1.6%= 8.3%.”unquote. But, if the interest rates go down by 1%, the fund’s YTM will also go down by 1% though the MD will rise by 1.61%. So, the overall returns will be 6.7%-1%+1.6%=7.3%. Isn’t it?
Regards,
Satish S.
LikeLike
Hi Satish..Thanks for your kind words…Going forward as you mentioned it will be 6.7%-1%+1.6%…but returns till date will be approximately 6.7%+1.6%..thanks for pointing this out 🙂
LikeLike
Thank you Arun.
LikeLike
Hi Arun,
where to get these graphs e.g Historical NAV movement graph, Credit Rating History etc
LikeLike
Hi, You can try websites such as morningstar and value research
LikeLike
Hi,
Thanks for your response.
I tried morningstar, its not showing the credit history in its “history” tab. valueresearch does show current credit ratings, not history.
Any other reference for same? or can you simply share the links here say for the funds you have taken as example in your article?
LikeLike
You can check the past factsheets to check the credit history. Unfortunately there is no one place where we get it.
LikeLike
Understood the concept, but I can’t fathom how exactly does the interest rate fluctuate? What factors would cause changes in the interest rates and can we be aware of any circumstances under which these rates would fluctuate?
LikeLike
This will be based on several factors such as inflation, growth, fiscal deficit,liquidity, RBI policy, current account deficit, currency movement, global interest rates etc
LikeLike
Sir, Isn’t the YTM declared monthly nowadays?
Considering the Franklin fiasco and the poor fd rates offered by banks, I am ignoring banks like Jana Small/IDFC/IndusInd etc., does it make sense to invest in Debt Funds? YTM of Axis liquid fund and HDFC money market fund is ~4%
LikeLike
God bless Arun! 😀 Great information.
LikeLike
Thanks Hemant 🙂
LikeLike