

In the first part of this series here, we discussed on how to evaluate valuations and plug it into our future returns estimates.
Today, we shall solve the next part of the future returns puzzle – Earnings.
Let me be honest upfront. I don’t think I know an exact method to predict earnings growth. In fact I don’t think I ever will 😦
So acknowledging this inability of mine, the idea here will be to work around with a simple framework which is not intended to be precise, but rather can be a good starting point in our conversations about equity return expectations.
Now that we are done with all caveats, let’s dive in..
How do we estimate future earnings growth?
Carl Jacobi to our rescue
Jacobi, a German 19th-century star mathematician, believed that the solution for many difficult problems could be found if the problems were expressed in the inverse – by working backward.

He was fond of saying, “Invert, always invert”
So instead of asking what will be the future earnings growth, what if we invert our problem and ask –
“For my expected returns from equities, what is the earnings growth required?
Let me explain..
Assume you need at least 15% from equities in the next 5-7 years.
In our earlier post, we found that
Returns from equity = Change in earnings + Change in PE valuations + Dividend Yield
The current trailing PE for Sensex is 23.5. As we had seen in our earlier post here historically we have always got the opportunity to exit above a PE valuation of 17x in the last 2 years of our investment time horizon.
Assuming we get to exit at 17 times PE, this implies a 28% absolute decline due to PE value coming down from the current 23.5 times.
This negative 28% spread across 5-7 years implies a compounded annual loss of ~5-6%.
The dividend yield of Sensex has historically hovered around the 1% to 1.5% range.
I intend to make around 15% from equities. (You are free to have a different return requirement)
Thus putting all this together,
Returns from equity required = 15%
= Earnings growth + Change in PE valuations (- 5 to 6%) + Dividend Yield (1%)
= Earnings Growth – (4 to 5%)
So for getting 15% returns from equities, the Sensex earnings growth should grow by around 20% for the next 5-7 years!
Phew, that gives us a fair idea of the expectations being built in. But how easy or difficult is this 20% number to achieve.
Let us take a look at history..
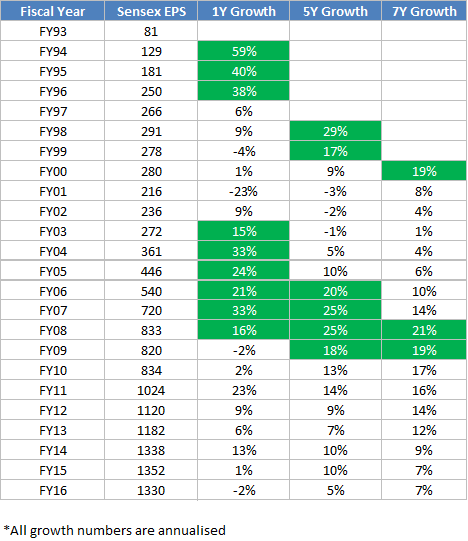
- FY 93-96 : 45% CAGR
- FY 96-03 : 1% CAGR
- FY 03-08 : 25% CAGR
- FY 08-16 : 6% CAGR
- FY 16-21 : ????
You can clearly see that Sensex earnings growth has remained cyclical and alternates between low and high growth periods.
So going by the historical trend, it seems reasonable to expect better growth over the next 5-7 years.
But let us dig further..
Source: MOSL
As seen above the Sensex earnings growth over a 5-7 year period has crossed 20% only in the FY93-96 period and FY 03-08 period.
- FY 93-96 is when Indian economy was opened up for foreign investments and its a one off event.
- FY 03-08 was primarily led by a strong global growth, domestic investment cycle and commodity bull run.
Now that means, there has only been 2 instances in the past where 20% expectations have been met. Out of which, one of them was led by a one off event, so technically it’s just one instance in the entire 23 years!
So while earnings growth, given their cyclical nature is expected to improve going forward, 20% growth is definitely not an easy ask.
What should happen for this 20% earnings growth to materialize?
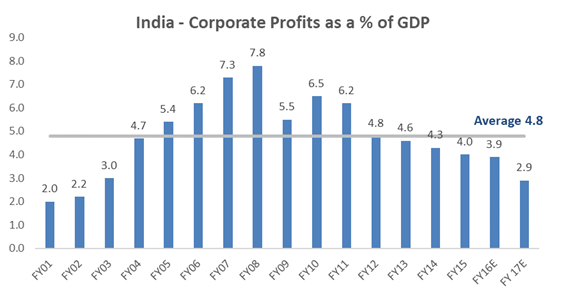
A simple way to evaluate where we are in the earnings growth cycle is by using the corporate profits as a % of GDP equation.
Source: MOSL, Livemint
In order to arrive at our approximate estimates for the next 5 year earnings growth, we need to project these two parameters
- Nominal GDP Growth (i.e Inflation + Real Growth)
- Corporate Profits as a % of GDP
Assumptions
- For nominal GDP growth, let us go by RBI estimates which is around 6-7% real growth + 4-5% inflation = 10 to 12% Nominal Growth
- We will assume that the corporate profit as a % of GDP moves closer to the long term average (5% of GDP) over the next 5 years. (to around 3.5% to 4.5% as a % of GDP)
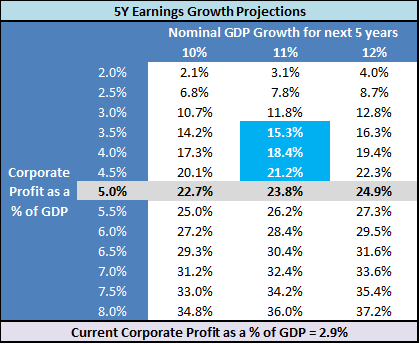
Going by this, our reasonable estimates of earnings growth for the next 5 years can be around 15% to 21%.
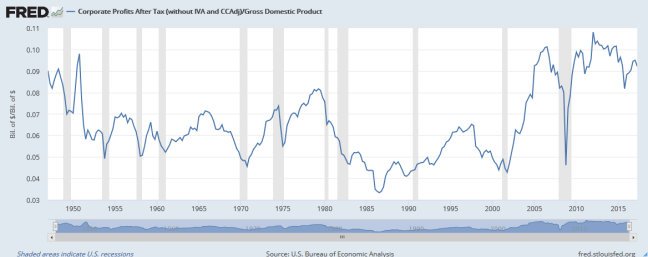
Great. The long term data clearly shows that Corporate Profits as a % of GDP is cyclical in nature. Thus our assumptions for mean reversion of Corporate Profits as a % of GDP in India is reasonable.
Ok, so where that does leave us with
- Earnings growth can be around 15% to 21% over the next 5 years
- Valuations will lead to a negative impact of 4-5% over the next 5 years
- Dividends will add around 1 to 1.5%
Thus overall return expectations for the Sensex over the next 5 years can be approximately around 11% to 17%
Mutual funds historically have done slightly better (by capturing higher earnings growth due to stock selection) and can be expected to provide ~1-2% out performance over the Sensex.
Now that we have a reasonable framework, depending on how reality evolves and we can improve or adapt our existing process.
All this is fine. But how in the world, do we convert all this mumbo jumbo into an executable framework?
Hang on till the next week..
Till then, happy investing as always 🙂
And, just in case you found what you just read useful, share with your friends and do consider subscribing to the blog along with the 1400+ awesome people, so that you don’t miss out on the next week’s post. Of course additionally you also get loads of free, interesting investment insights delivered straight to your inbox.
Disclaimer: All blog posts are my personal views and do not reflect the views of my organization. I do not provide any investment advisory service via this blog. No content on this blog should be construed to be investment advice. You should consult a qualified financial advisor prior to making any actual investment or trading decisions. All information is a point of view, and is for educational and informational use only. The author accepts no liability for any interpretation of articles or comments on this blog being used for actual investments

I think your blog needs some fresh content. Writing manually
takes a lot of time, but there is tool for this time consuming task,
search for; Ssundee advices unlimited content for any blog
LikeLike
Nice one, Arun.
LikeLike
I have noticed you don’t monetize your page, don’t waste your traffic, you can earn extra bucks every month because you’ve got high quality content.
If you want to know how to make extra $$$, search for:
Boorfe’s tips best adsense alternative
LikeLike
Reblogged this on Anand Jeyahar.
LikeLike
Hi Arun, have been reading this blog recently. Thanks for your articles.
I have one question in this article: how did you arrive at the numbers in the corporate earnings growth projection table?
LikeLike
Thanks for writing back 🙂
The current corporate profit to GDP is 2.9%. So lets say the GDP is 100, then the corporate profit is 2.9. In 5 years if the nominal growth is 11%, then the GDP will grow from 100 to 168.5. Now if the corporate profit to GDP improves to say 3.5%, then the corporate profit post 5 years will be 3.5% of 168.5 = 5.90. So corporate profits have grown from 2.9 to 5.9 which implies an absolute growth of 103% or 15.3% compound annualised growth over 5 years. Similarly we can calculate for other combinations of Nominal GDP growth and corporate profits as a % of GDP. This exercise will give a fair idea of the earnings growth environment going forward.
Hope it helps 🙂
LikeLike
Thanks, Arun.
Kept me up late thinking of how the percentages were calculated but finally worked it out using the CAGR formula.
Confirmed it with your detailed explanation next day.
Now onto the next blog article; may bother you again.
Thanks, again.
LikeLike
Sure..Anytime 🙂
LikeLike