
In my earlier post here, I had discussed on how a “what-if-things-go-wrong” plan helps you preload your decisions and reduce the no of decisions during market fall.

Since this thought process has evolved only recently for me, I have not really got the chance to test it out as I am waiting for the next fall.
As always I have my doubts as to –
What if this is just some fancy intellectual gyaan?
Let us use history as a guide and check if this makes practical sense..
As mentioned earlier, the primary objective is to –
Reduce the number of decision points during a market fall
Let us check if our plan helps in this endeavor.

So let me time travel back by 28 years (since Nifty Index was started) and check on how many decisions I needed to take when markets started to fall.
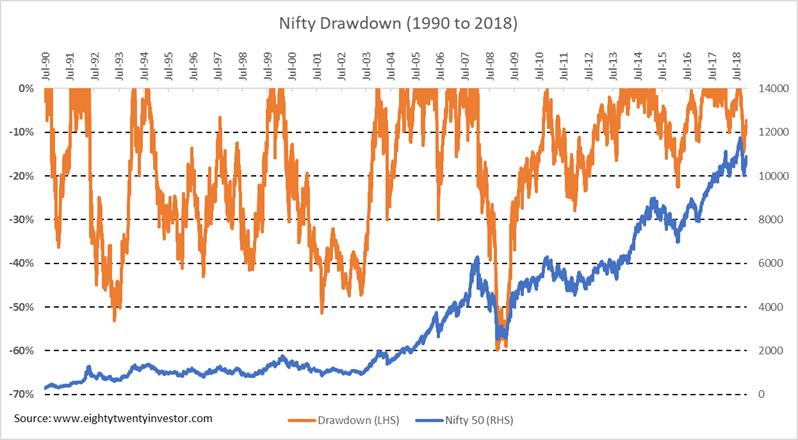
In the above chart the orange line represents the % fall of Nifty from its previous peak value on each and every day for the last 28 years. This is called draw down chart.
But here is something that will shock you:
In the last 28 years, for 94% of the days Nifty was down from its previous peak!
That simply means I will almost, always have to go through the retrospective feeling “If only I had sold earlier..”.
Here is the killer – Along with it the decision on “Will the market go down further?” will also need to be taken on 94% of the days!
Earlier, I had always believed that markets were too volatile and decisions have to be made real time – each and every time the market went down. The decision could be anything – to reduce/exit equities, to buy more, to hold etc.
Now to put that in context, that meant in the last 28 years I would have had to make ~6482 decisions as for 6482 days out of 6893 days the Nifty draw down was negative !
Take a pause and get that number into your head – we are looking at around 7000 decisions over the next 30 years. Phew.
Ok. To take a decision for each and every minor fall is stretching it too far. Let us say, we need to take a decision only when the fall (read as fall from previous peak) is more than 10%.
Any guesses on the no of decisions?
4171 decisions in the last 28 years. That is almost 150 decisions every year!
What if its only for a fall above 20%?
Still we are left with 2734 decisions.
Now you get the gist.
Too many decisions..
The moment we start looking at each and every fall as a decision making point, it becomes extremely stressful as the near term is always uncertain and there is nothing much you can do about the how the markets should behave.
Further, the more the number of decisions we need to take, the higher is the possibility of panicking out of the market.
Deciding when to decide..
Let us check how our new approach of reducing the decision making points to 10%,20%,30%,40%,50% would have fared.
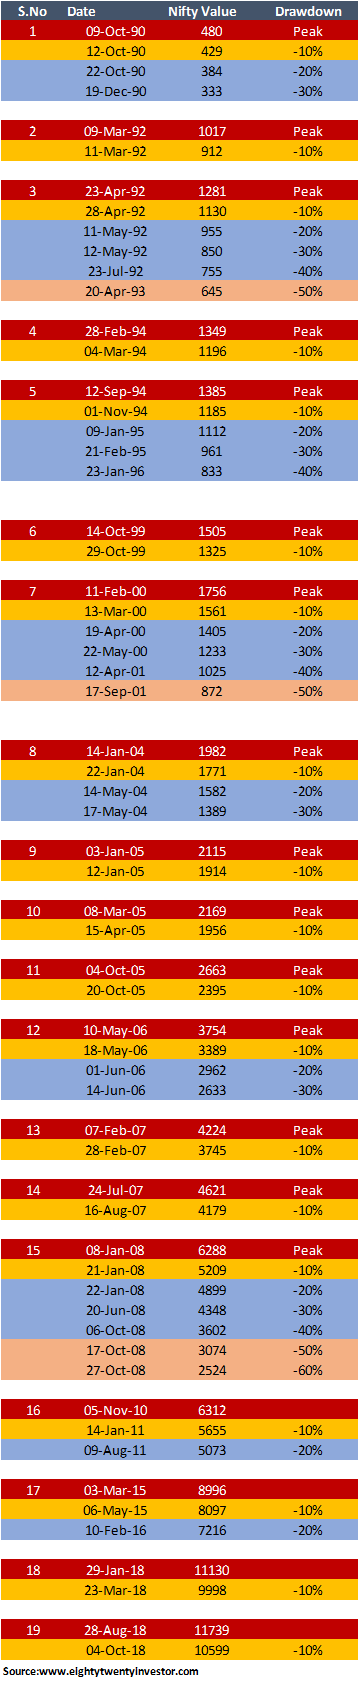
There have 19 instances in the last 28 years where, the bare minimum 10% drawdown trigger has occurred.
Out of 19 occurrences, only 3 times did the 10% drawdown actually get converted into a 50% fall. This means a 50% fall is a very rare event and in the next 30 years going by history we might see only 3-4 of them.
Similarly, only 9 out of 19 times has the 10% drawdown actually become a 20% correction.
So the takeaway for us is that – a 10% drawdown is too common while a 50% is too rare.
So let us keep our decision making points to 20%,30% and 40% fall.
This implies in the last 28 years, our decision making points during a market fall has been dramatically reduced to 9 periods and just 20 decisions !
So our strategy of “deciding when to decide” does make sense.
Summing it up..
Hence our “What if things go wrong plan” will have
- 20% fall
- 30% fall
- 40% fall
as our decision making points..
Now we are left with the interesting second part – preloading decisions for these 3 scenarios.
How do we do that?
Hang on for the next part..
If you loved this post, do share it with your friends and don’t forget to subscribe to the blog via Email (1 weekly newsletter) or Twitter along with the 5000+ awesome people. Look out for some fresh, super interesting investment insights delivered straight to your inbox.
If in case you have any feedback or need any help regarding your investments or want me to write about something, feel free to get in touch at rarun86@gmail.com
You can also check out all my other articles here
Disclaimer: All blog posts are my personal views and do not reflect the views of my organization. I do not provide any investment advisory service via this blog. No content on this blog should be construed to be investment advice. You should consult a qualified financial advisor prior to making any actual investment or trading decisions. All information is a point of view, and is for educational and informational use only. The author accepts no liability for any interpretation of articles or comments on this blog being used for actual investments

I think it is very nicely and neatly explained. Each downfall should not result into some action and decision – often a panicky decision, if you are an investor. Well, it you are a trader or even worse/good, a day trader, then, these theories do not apply. Then you need to quickly take a decision and enter/exit.
Though, I am not sure whether this theory applies to individual stock in terms of fall / draw-down or the total investment basket. Because it happens many-a-times that individual stock is lower by say 40% but the portfolio is down only by say, 10% or 20%. So what is the decision point.
LikeLike
Thanks Kamal. The decisions are a lot more hands-on when it comes to individual stocks and hence the above method is predominantly applicable only to a portfolio containing funds.
LikeLike
VERY GOOD ARTICLE
LikeLike
Thanks a ton Bhavin
LikeLike
Thanks Bhavin. Glad you liked it 🙂
LikeLike
Easy to understand article. Can you do a similar article for booking profits when market is on the rise? That will be very helpful for planing an exit strategy when markets are overbought.
LikeLike
Sure. Will do Raj. Thanks for the feedback.
LikeLike
Hi
Great article Arun…really provide an insight on how one should try to automate investments.
However, I think above process is very well suited only to index funds. what do you think?
LikeLike
True. This is more suited for a mutual fund/index based portfolio
LikeLike
Hi
Bit confused, in one place ” it is mentioned that a decision only when the fall (read as fall from previous peak) is more than 10%.
Any guesses on the no of decisions?
4171 decisions in the last 28 years. That is almost 150 decisions every year!
What if its only for a fall above 20%?
Still we are left with 2734 decisions.
Now you get the gist.”
In another place “There have 19 instances in the last 28 years where, the bare minimum 10% drawdown trigger has occurred.”
How can both be right? or am i missing something.
LikeLike
Apologies for the confusion. In the first case, I meant that if you didn’t have decisions point defined, there were 4171 days where the market drawdown was more than 10%. And similarly there were 2734 days where the drawdown was more than 20%.
In the second instance, instead of all days where drawdown is less than 10%, the decision point is only the first time the drawdown becomes 10% (the instances can be referred from the table).
Do let me know if this works for you.
Also a big fan of your blog Shankar. Thoroughly enjoy your writing 🙂
LikeLiked by 1 person