

The new SIP culture..
One of the best things to have happened in recent times, is the advent of new fintech firms like Kuvera, Paytm Money, Scripbox etc. These folks are doing a great job and hopefully should be able to build the culture of monthly savings into equities (read as SIP) for the rest of us.
While a lot of people are starting their SIPs, I am also worried that somewhere we might not be setting the right expectations.
Most of these firms primarily provide returns and ratings. Now if I were you, naturally I would be anchored towards a higher return fund.
This fund has the highest return over the last 5 years. The fund must be doing something right. Let me invest..
And then reality strikes. As you watch your investment month after month, the returns seem to be a far cry from what you expected.
For example, you can check how my live SIP portfolio has moved in the last 8 months here.
Oops. This is not what you thought and you stop your SIPs just at the wrong time…

Unfortunately, the short term is a lot more different that the long term.
Higher returns have a cost. The cost is paid emotionally.
You have to get used to the uncomfortable feeling of seeing your hard earned money go down and up at regular intervals.
Unless and until we have our expectations set right for the short term, we won’t be able to survive the long term where the actual magic happens.
The idea of this post is to help you understand the short term pain which needs to be endured to experience great long term returns.
So how do we go about setting the right expectation for short term volatility?
Two parts of an SIP
An ongoing SIP has two components:
1) The part of the portfolio that has already been built via SIP
2) The incremental SIP that will get added
For eg, assume you invest, Rs 10,000 every month for the next 10 years in a few equity funds and the returns are 15% annualized. This is how your portfolio would have grown.
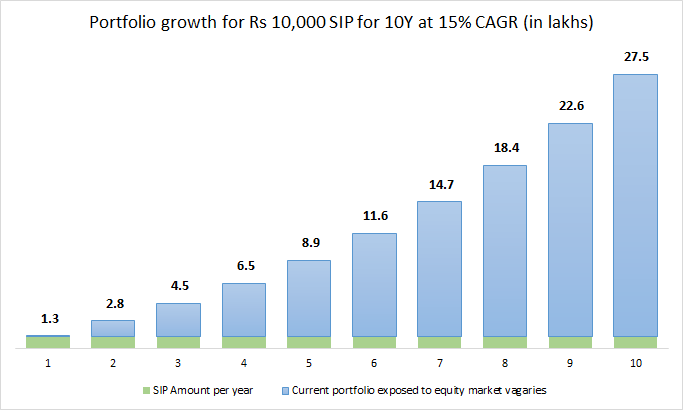
The blue bar represents the part of the portfolio that has already been built via SIP. The green bar represents the additional SIP flow for every year.
The usual argument in favor of an SIP is that, as we invest our money across several months, even as equity markets go up or down, we end up averaging our buying price. And hence the notion that, we don’t need to be worried about market ups and downs, as the SIP will take care of it and in fact take advantage out of volatility.
A quick glance at the above chart and you know what we are missing.
While the above logic works well in the initial years, as time progresses, the incremental amount which gets invested via an SIP over a year becomes small compared to the overall portfolio.
And hence, while the incremental amount is averages out equity ups and downs across 12 months, the larger component i.e your existing portfolio (which is already built via past SIPs) is completely exposed to equity markets ups and downs.
So to set short term expectations, we need to build expectations for both these components separately and add it up.
But how do we do this?
And even before that.
What the heck is short term?
Earlier I used to consider 1 year as a period for measuring short term ups and downs. But extensive research done by the US firm Riskalyze points out that 1 year is too long for most investors to stay calm during a market fall and most of the decision making is done on a 6 month basis.
So we shall use 6 months, to set our near term risk expectations (read as the range of ups and downs to be expected).
Component 1: Portfolio which is already built
The detailed explanation for setting 6 month expectations, has already been discussed in our earlier post here.
Based on this, we had found that for any 6 month period, 95% of the times, a 100% equity portfolio ended up with returns anywhere between -26% to 52%.
Now obviously we won’t be able to predict where exactly in the range the portfolio returns would be over the next six months. But the key idea is that, even if the portfolio falls 26% over the next 6 months, this is expected to be a part of the normal behavior of the portfolio and we should be ok with it.
That being said, this outcome range covers only for 95% of the scenarios which we can quantify. There is about 5% of the risk that we can’t quantify. The outlier ‘black swan’ type events we saw in 2008 are a good example.
The same 100% equity portfolio was down around ~60% during the sub prime crisis of 2008!
So our expectations should factor in a normal scenario of upto 26% fall over a 6 month period which may happen at regular intervals. At the same time, we must also be aware that the fall can go up to 60% or even more during rare crisis type scenarios.
Component 2: Next 6 month SIP
For a 6 month SIP of Rs 10,000 (i.e an investment of Rs 60,000 in total) – the portfolio value for 95% of the times has ended up in the range between Rs 50,000 to Rs 80,000.
The worst ever value has been at Rs 40,000.
The above value has been calculated using Nifty (from 1990)
So using this we can calculate for different amounts.
For eg if you have a Rs 20,000 SIP, then you can expect the portfolio value to be anywhere between Rs 1,00,00 to Rs 1,60,000 in the next 6 months. This uncertainty is the emotional cost that you are required to pay for getting long term SIP returns.
SIP short term volatility expectation formula
This is how you can set expectations for the next 6 months:
95% of the times it will be in the range of
Lower Range =
(100%-26%) * Component 1 + (SIP Amount/10,000)*50,000
Upper Range =
(100%+52%) * Component 1 + (SIP Amount/10,000)*80,000
Real Life SIP Portfolio
I run an SIP of Rs 30,000 every month in two equity funds. This was started on 05-Aug-2018 and the details on the live portfolio is available here.
Going by our logic, we should be ok if our portfolio value is between Rs 1,50,000 to Rs 2,40,000.
After 6 months, on 05-Feb-2019, the value of my portfolio was around Rs 1,75,000 (I have not included the Rs 30,000 invested on that day). While my portfolio was in loss by Rs 5,000, this was within the expected volatility range. Nothing to panic. My portfolio behavior was as per expectation.
Now how do we set the next 6 month expectation?
As per our formula, the 95% return range outcome would be
Lower Range: Rs 1,75,000 * (100%-26%) + Rs 50,000 * (30,000/10,000) = 1,29,500 + 1,50,000 = Rs 2,79,500 (let me round it to Rs 2.8 lakhs)
Upper Range: Rs 1,75,000 * (100%+52%) + Rs 80,000 * (30,000/10,000) = 2,66,000 + 2,40,000 = Rs 5,06,000 (let me round it to Rs 5 lakhs)
So in the next six months, that is on 05-Aug-19, I would expect my portfolio (actual investments of Rs 3.6 lakhs) to be between Rs 2.8 to Rs 5 lakhs. This would be considered normal behavior from my portfolio.
If there is a black swan event, then my portfolio can fall even more than this. It is reasonable to expect one major crisis event every ten years.
I have a 10+ year time frame for my SIP. This means I have 20 six month periods to stay invested. Even if I lose out on a few periods, going by history of equities, majority of six month periods will be in my favor and hence I get to experience better returns over the long run.
In a similar manner, you can start building reasonable volatility expectations over the next 6 month period for your SIP portfolio.
The key idea is to stay for long term returns, one six month period at a time!
Summing it up..
The hope is that with the right expectations you will confidently navigate the short term volatility, continue with your SIPs and eventually end up experiencing awesome long term returns!
Do share your feedback and let me know if it works for you. You can also mail me at rarun86@gmail.com.
Happy investing as always!
If you loved this post, share it with your friends and don’t forget to subscribe to the blog via Email (1 article per week) or Twitter along with the 6000+ awesome people. Look out for some fresh, super interesting investment insights delivered straight to your inbox.
You can also check out my other articles here
Disclaimer: All blog posts are my personal views and do not reflect the views of my organization. I do not provide any investment advisory service via this blog. No content on this blog should be construed to be investment advice. You should consult a qualified financial advisor prior to making any actual investment or trading decisions. All information is a point of view, and is for educational and informational use only. The author accepts no liability for any interpretation of articles or comments on this blog being used for actual investments.

Hey thanks for a wonderful article.would you mind sharing the best 3 mutual fund across different industries to get great returns over a period of 15 years. thanks
LikeLike
The word “best” is a dangerous one. No one including the fund managers know which is going to be the top fund over the next 15 years. We can attempt at identifying a “good enough” fund. You can refer to my how to select equity funds series to find out how I choose funds.
LikeLike
Great read, but I was tripped up a bit with the term “Component 1”, if I understand it is right, this is the corpus accumulated as on date of calculation, correct?
LikeLike
Yup. That’s right!
LikeLike
I think you have to be emotionally prepared for investing in SIpa, but firms don’t do enough work with preparing clientele.
LikeLike