
I’m super excited to announce that my debut book, ‘The 80-20 Money Makeover: A Simple Yet Powerful System to Transform Your Financial Future’, published by Harper Collins India is now available for order on Amazon!
You can check out the book here: Book Link
I’ve explained most of the ideas and concepts in the book using illustrations, tables, and graphs to make them easier to understand. Since physical books have space constraints for printing, I’ve included high-quality images of some of the visuals here for better clarity.
Level 1: Striking the Right Balance between Saving and Spending
No tables/figures
Level 2: Building a Safety Net
No tables/figures
Level 3: Planning for Short-Term Money Goals
No tables/figures
Level 4: Building Your Long-Term Wealth-Creation System
Level 4 – Stage 1: Early Wealth-Creation Stage
Level 4 – Stage 1 – Chapter 1: The invisible fund in your portfolio
Figure 2 (Page 54)
Level 4 – Stage 1 – Chapter 4: How to automate your monthly long-term investments
Figure 4 (page 68)
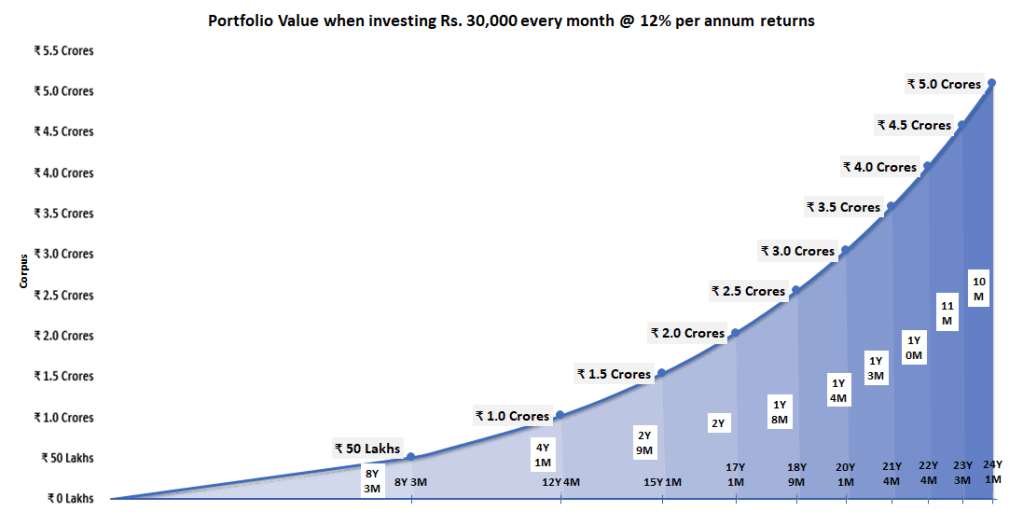
Figure 5 (page 69)
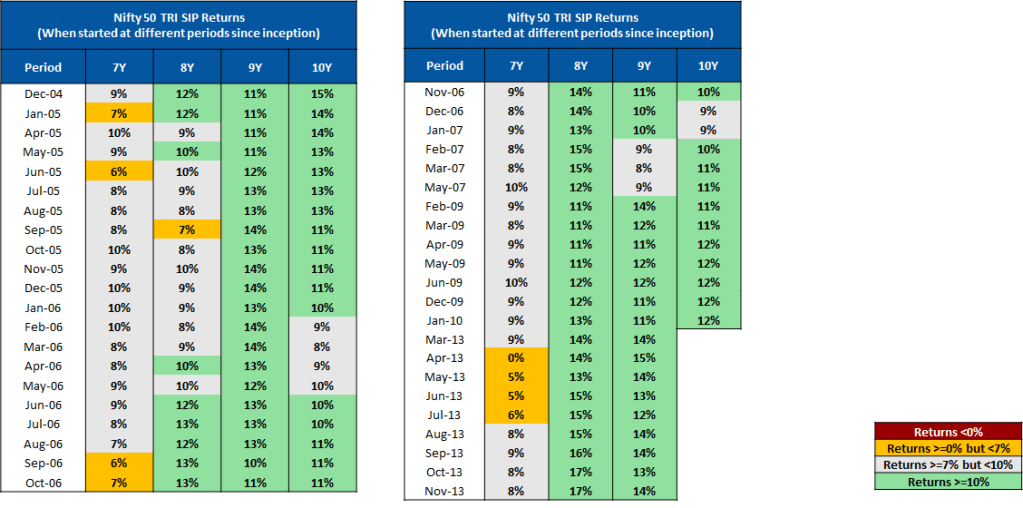
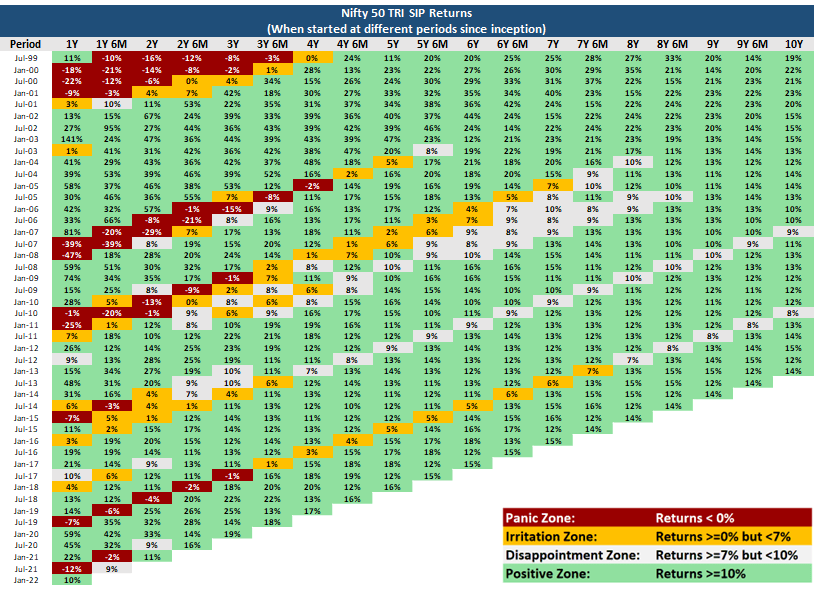
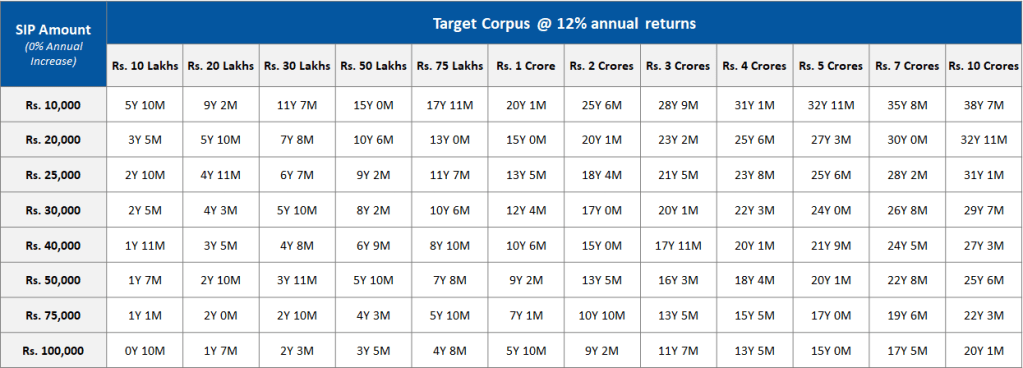
Level 4 – Stage 1 – Chapter 5: Does an equity SIP deliver good returns in the long run?
Table 3 (Page 72,73,74)
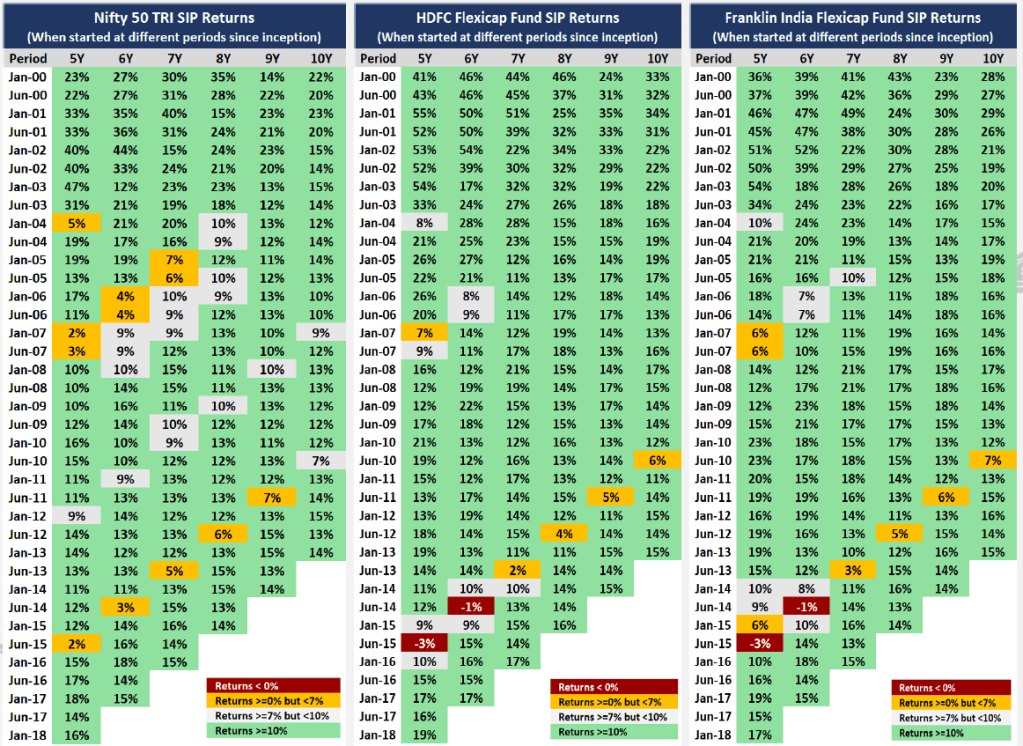
Figure 6 (page 77)
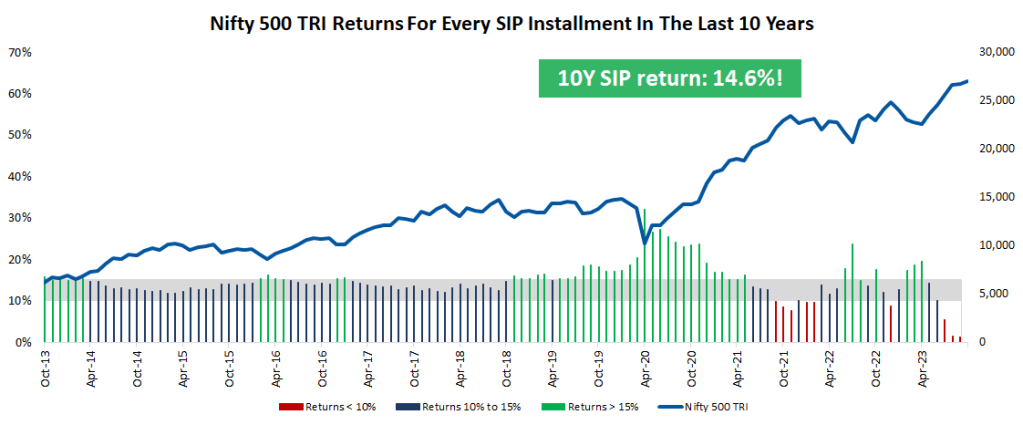
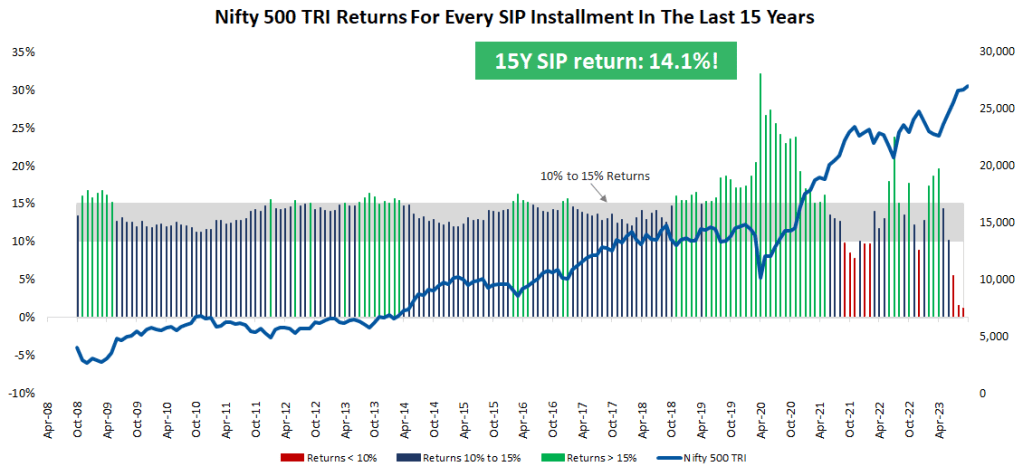
Figure 7 (page 78)
Level 4 – Stage 1 – Chapter 6: How ‘long’ is long term when it comes to investing in equities via SIPs
Table 6 (page 81)
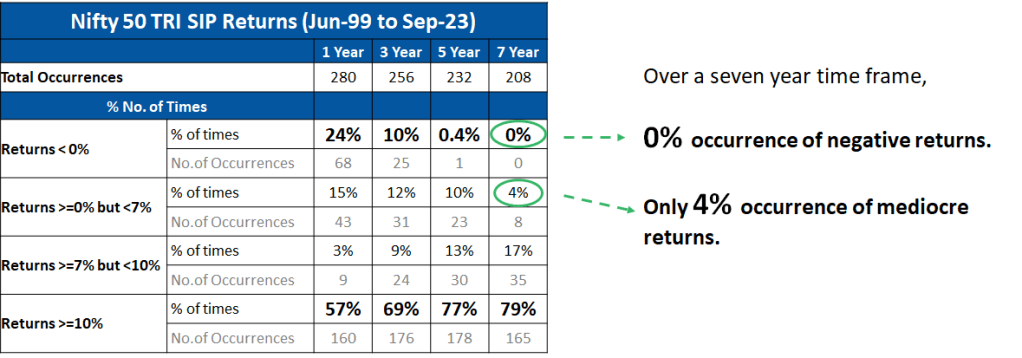
Figure 8 (page 81)
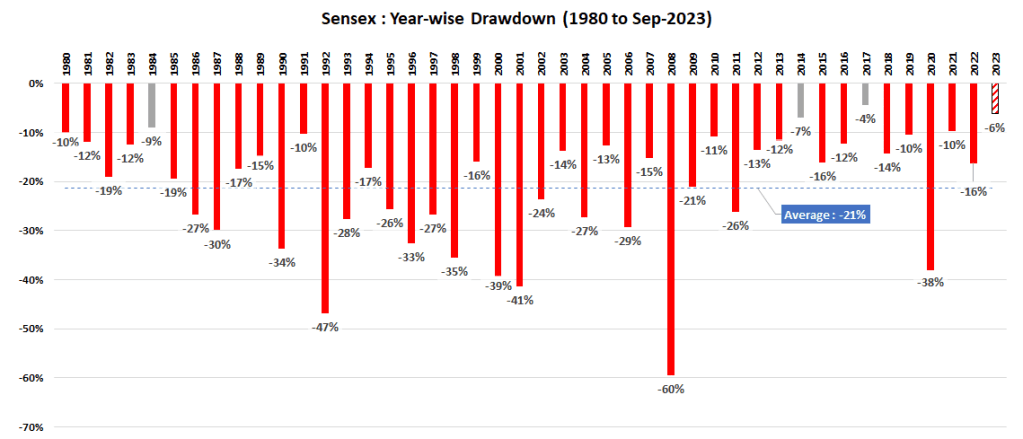
Table 7 (page 82)
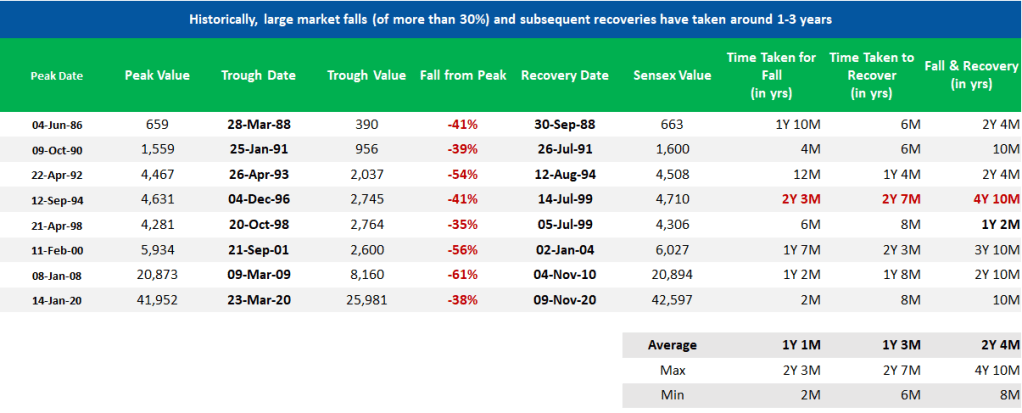
Table 8 (page 83)
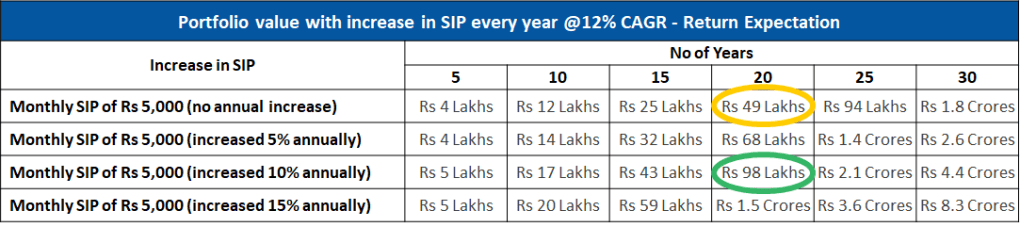
Level 4 – Stage 1 – Chapter 8: One simple trick to double your money in twenty years
Table 9 (page 88)
Level 4 – Stage 1 – Chapter 9: Equity SIPs deliver great returns in the long run, but why do most of us give up midway
Table 10 (page 91)
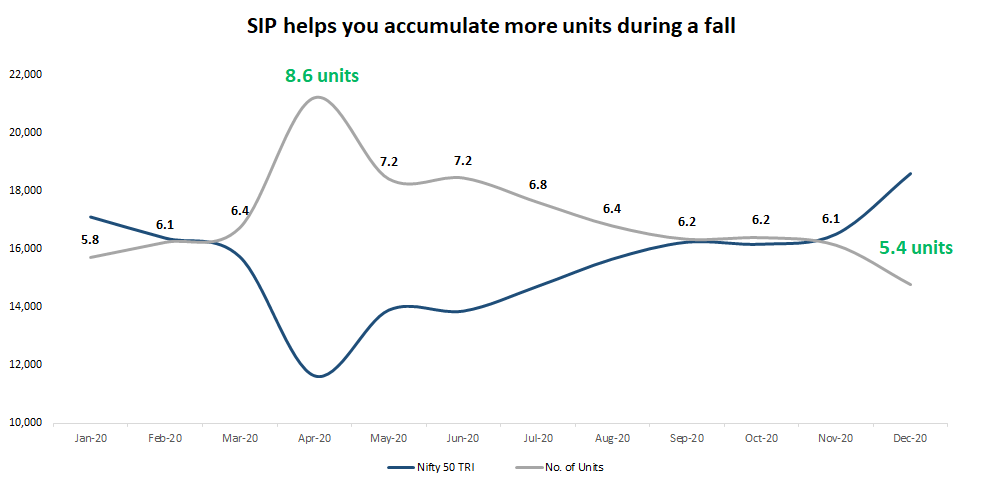
Level 4 – Stage 1 – Chapter 11: Common questions about equity SIP investments
Figure 9 (page 94)
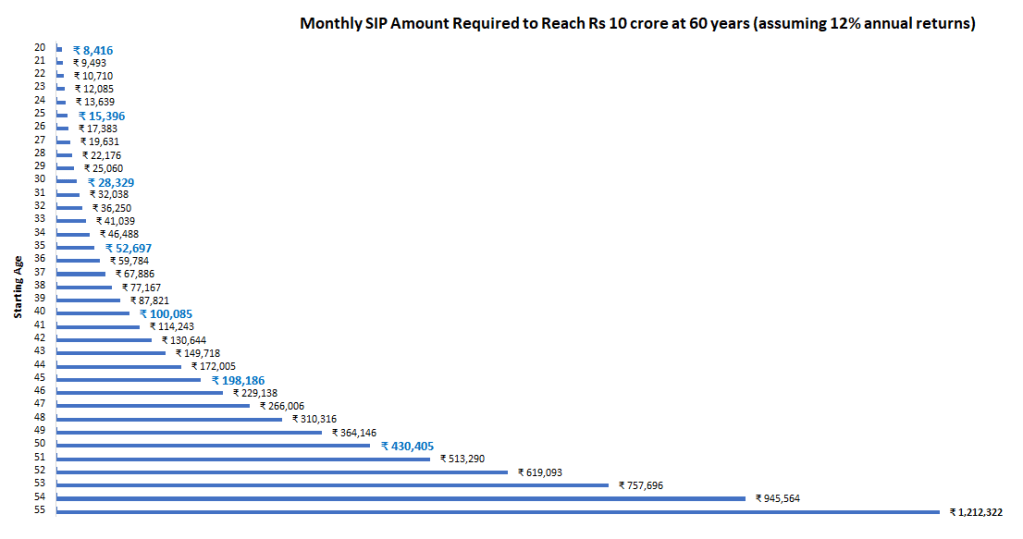
Table 11 (page 95)
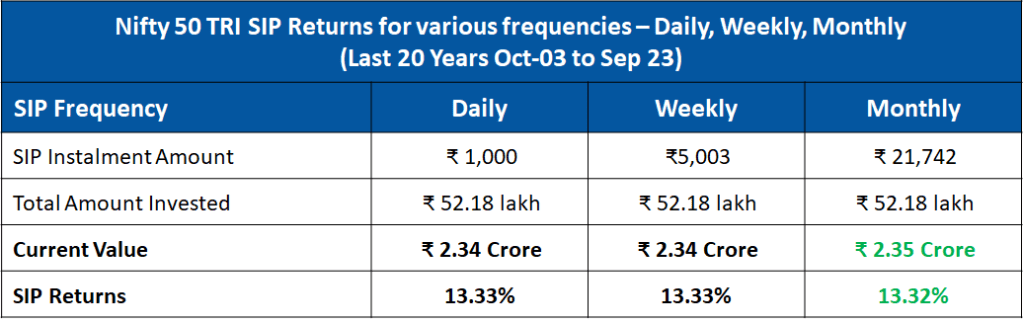
Table 12 (page 96)
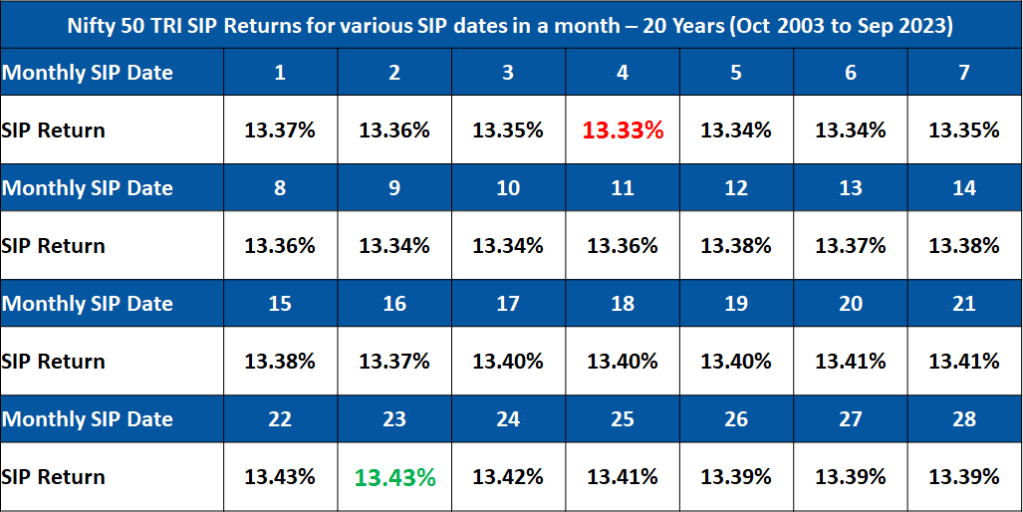
Figure 10 (page 97)
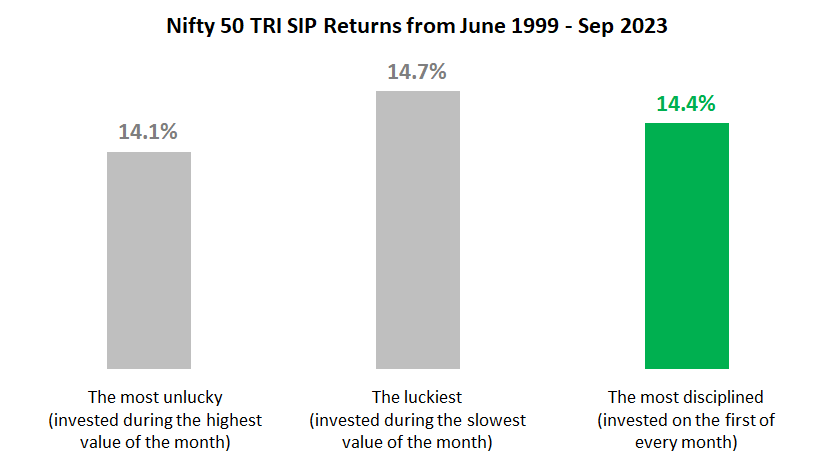
Figure 11 (page 98)
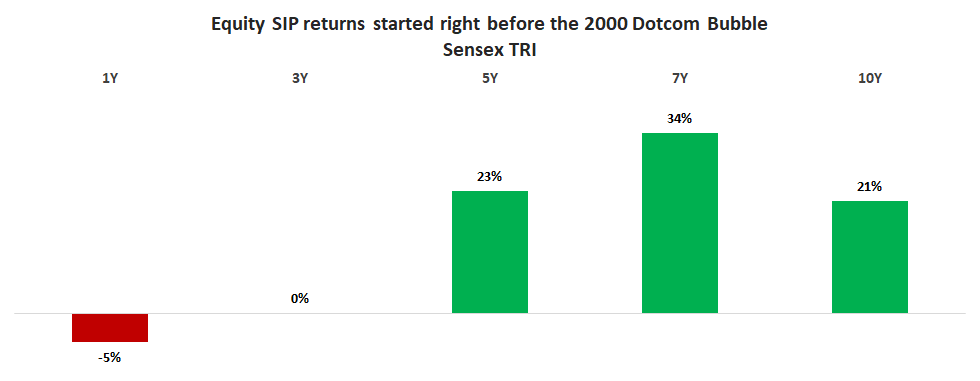
Figure 12 (page 99)
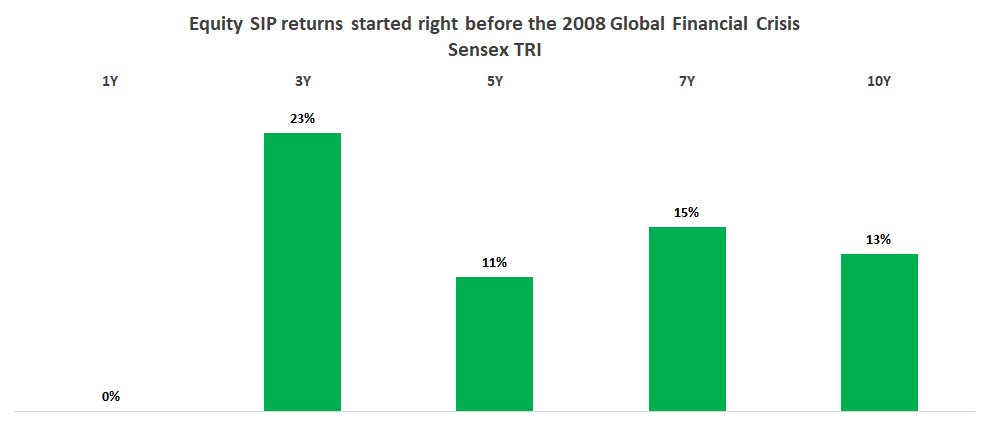
Table 13 (page 99)
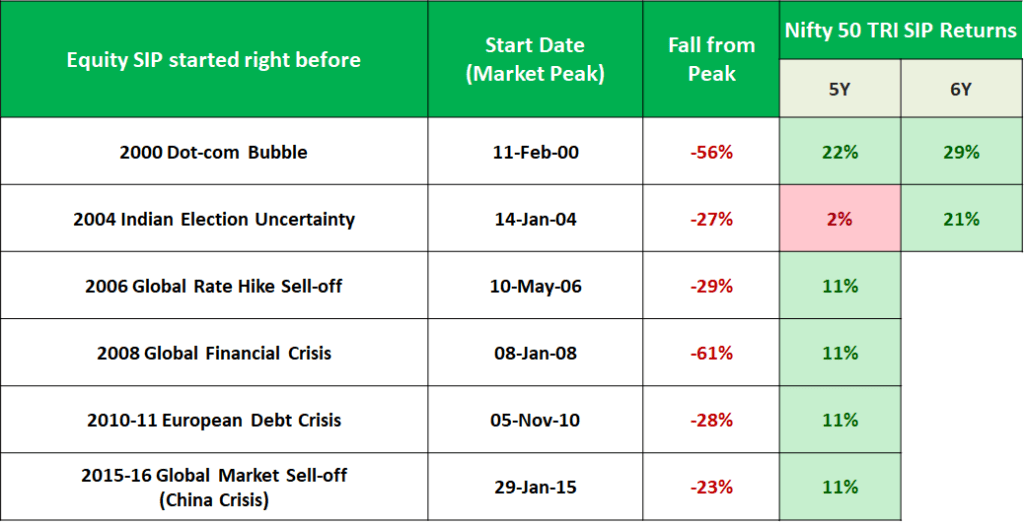
Table 14,15,16 (page 100-101)
Level 4 – Stage 2: Advanced Wealth-Creation Stage
Level 4 – Stage 2 – Chapter 1: How to choose your asset mix?
Figure 13 (page 121)

Table 19 (page 123)

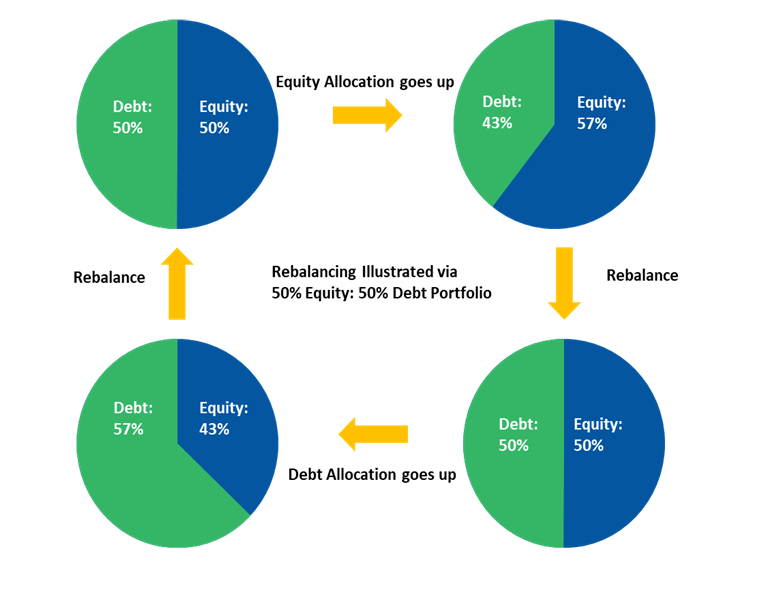
Level 4 – Stage 2 – Chapter 2: Daedulus and the art of rebalancing
Figure 14 (page 131)
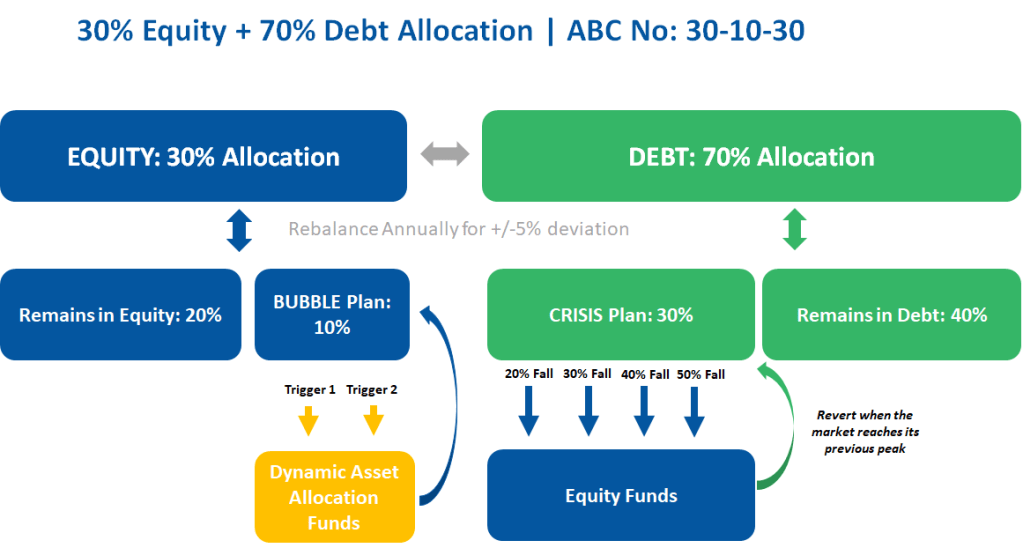
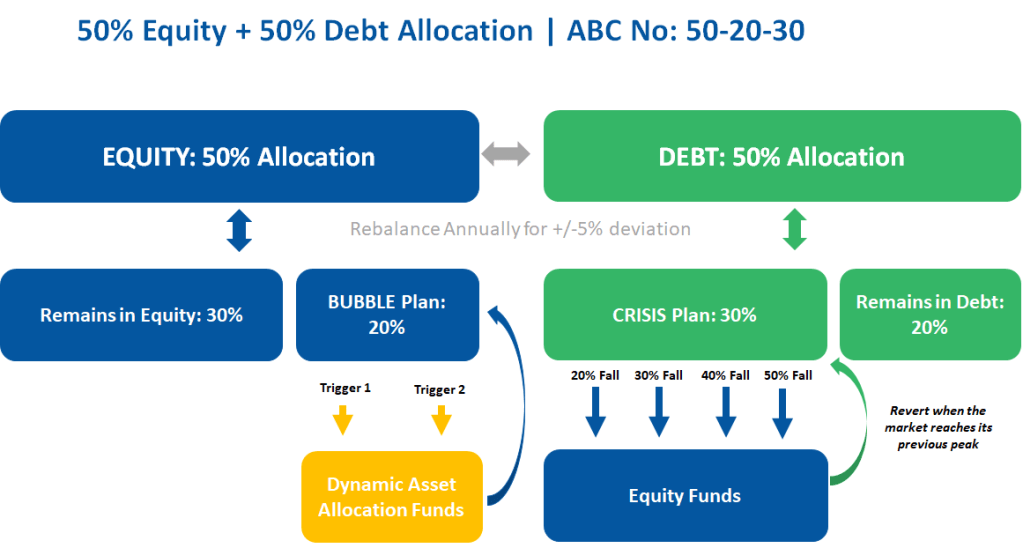
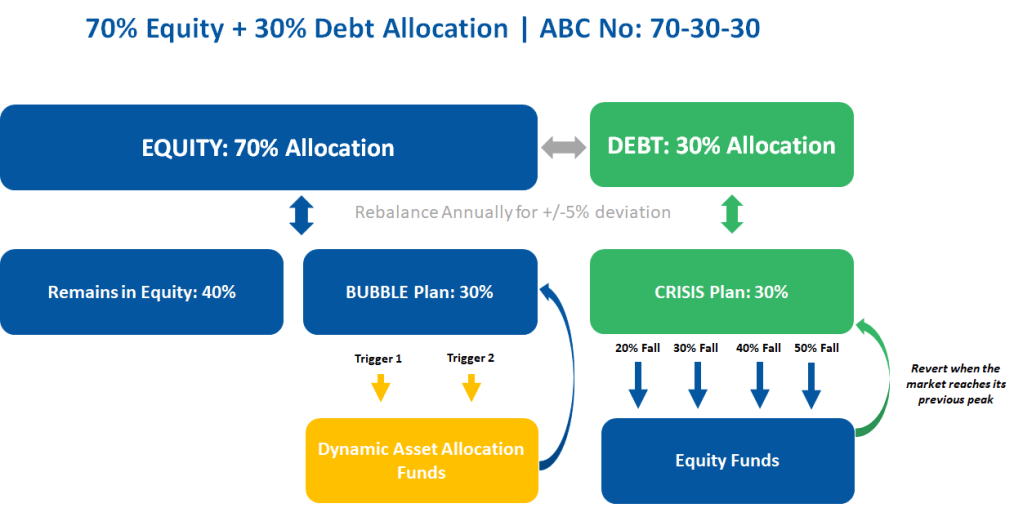
Level 4 – Stage 2 – Decide your portfolio ABC number
Figure 15-17 (page 160-162)
Level 4 – Stage 2 – Entry & Exit Strategies – How to deploy lumpsum money in equities
Figure 19 (page 206)
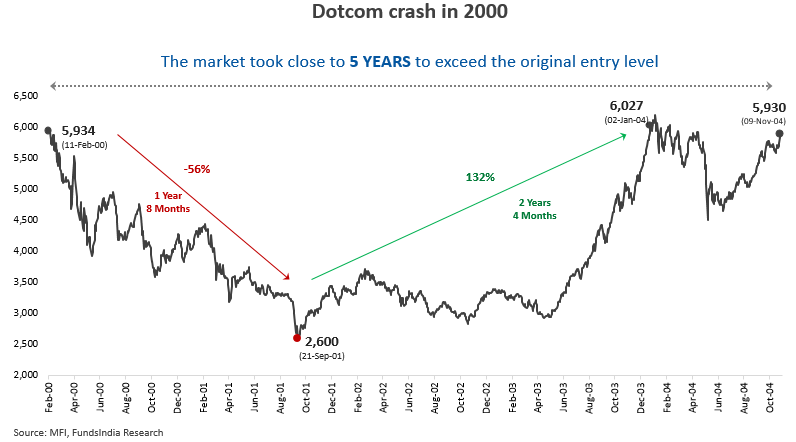
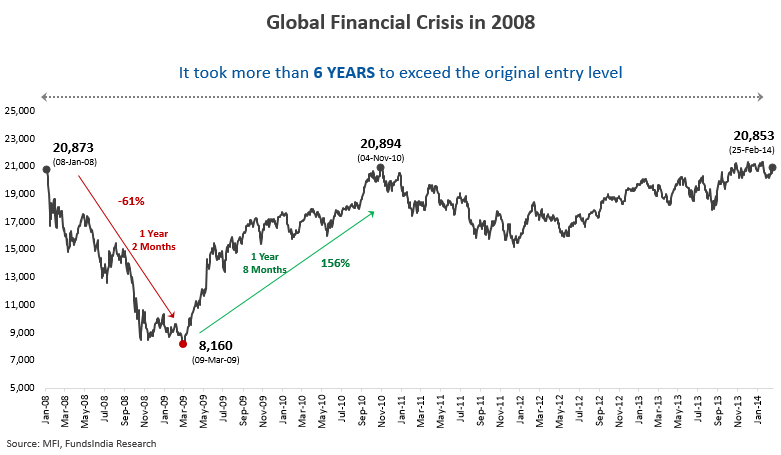
Table 28 (page 207)
Level 4 – Stage 3: Financial Freedom Stage
No tables/figures
Level 5: Outbehaving Your Way to Wealth
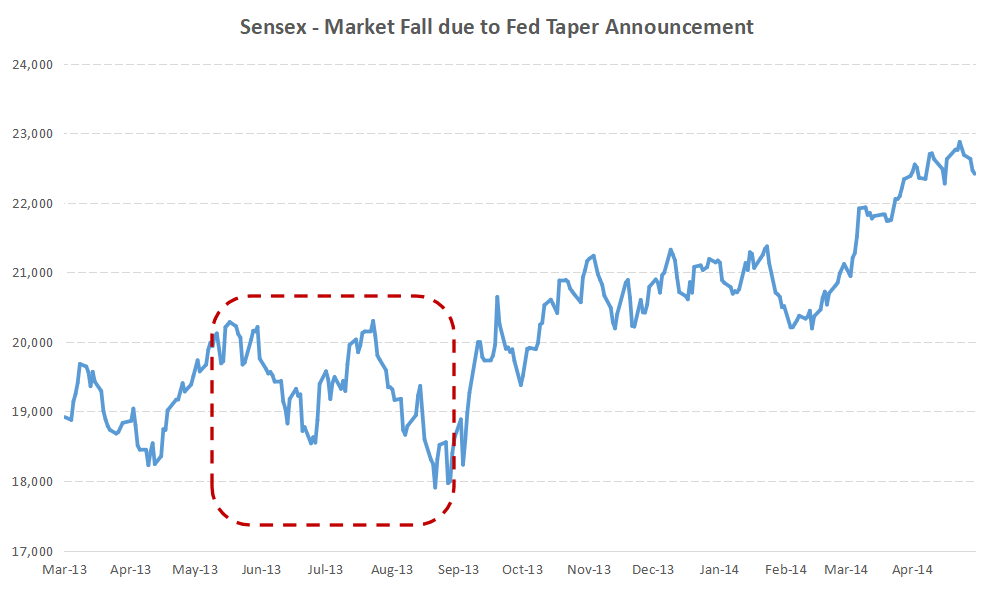
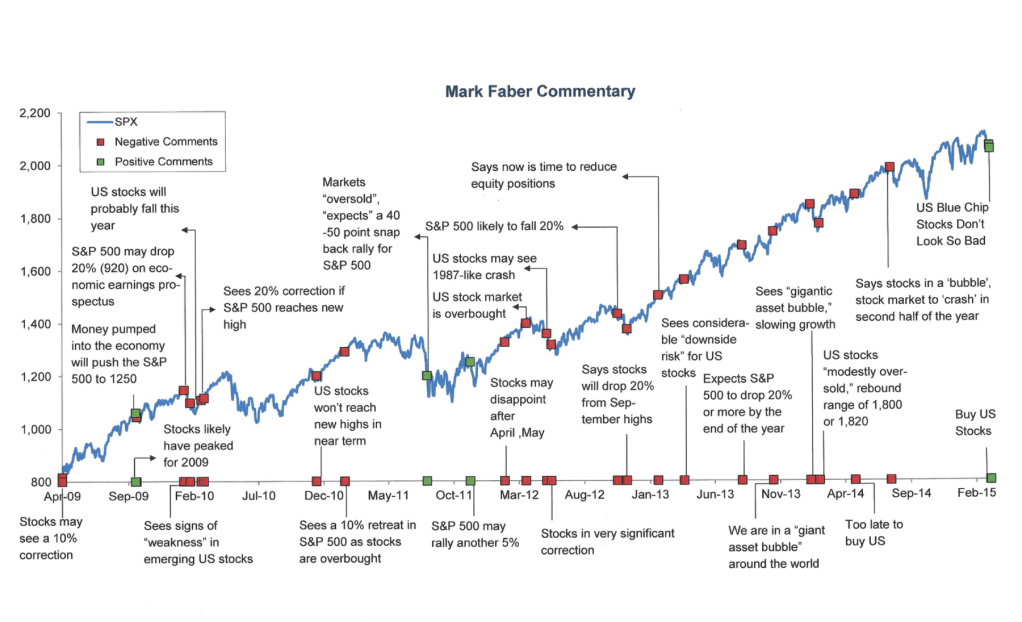
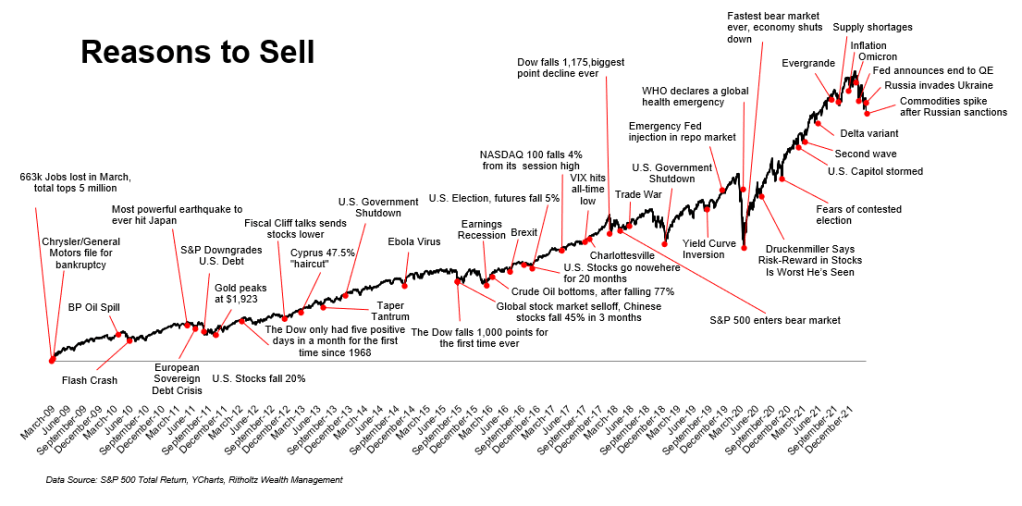
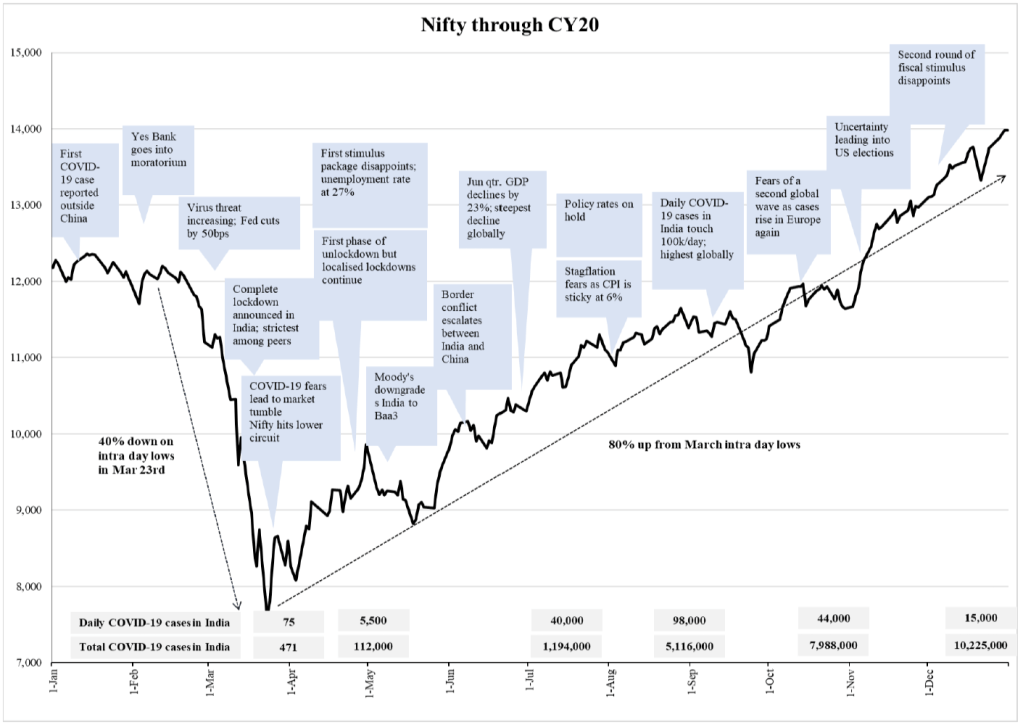
Level 5 – Bull market mistake 1: Acting on scary bubble market warnings
Figure 22 (page 256)
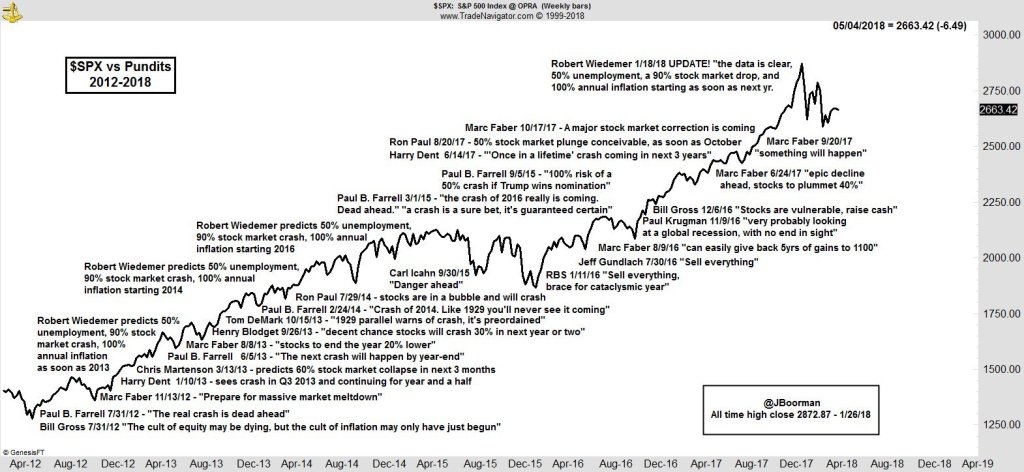
Figure 23 (page 257)
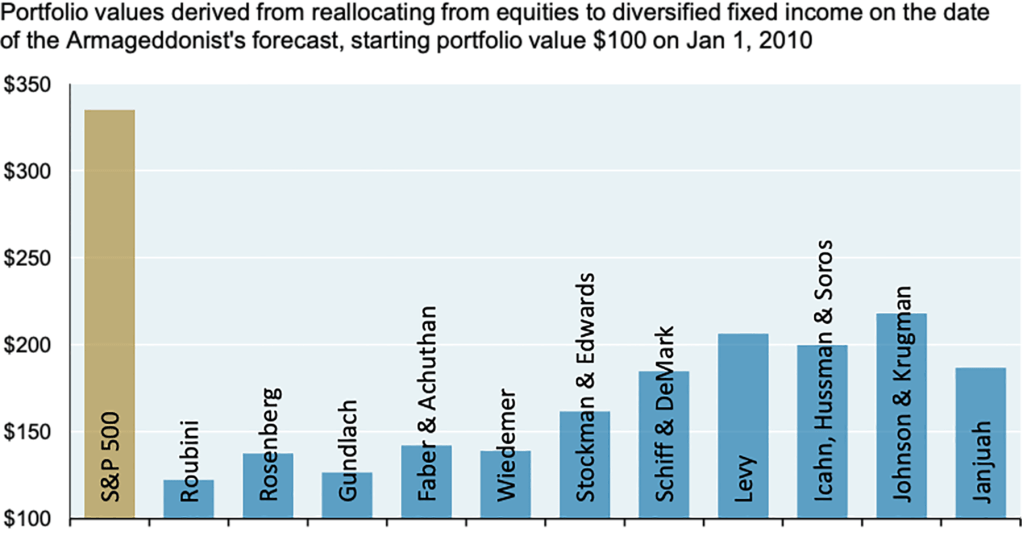
Figure 24 (page 260)
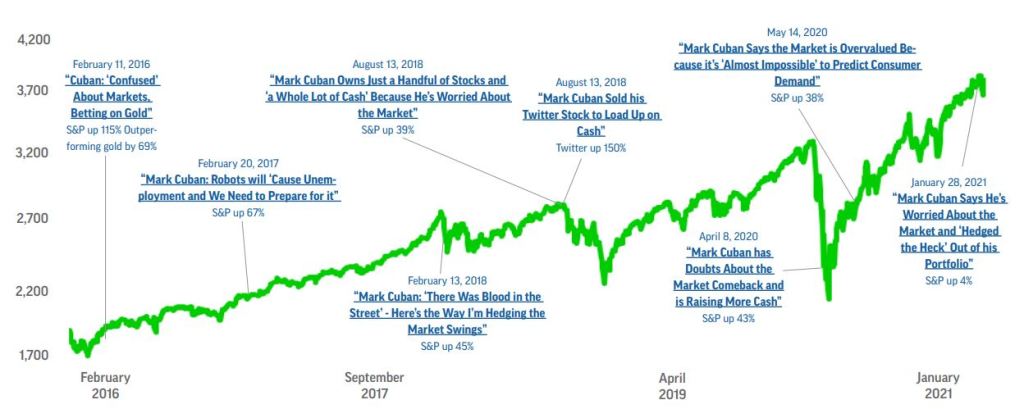
Figure 25 (page 261)
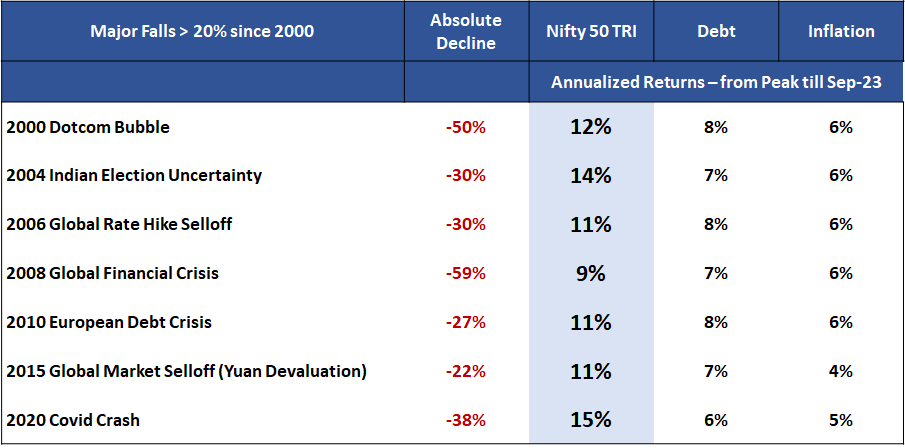
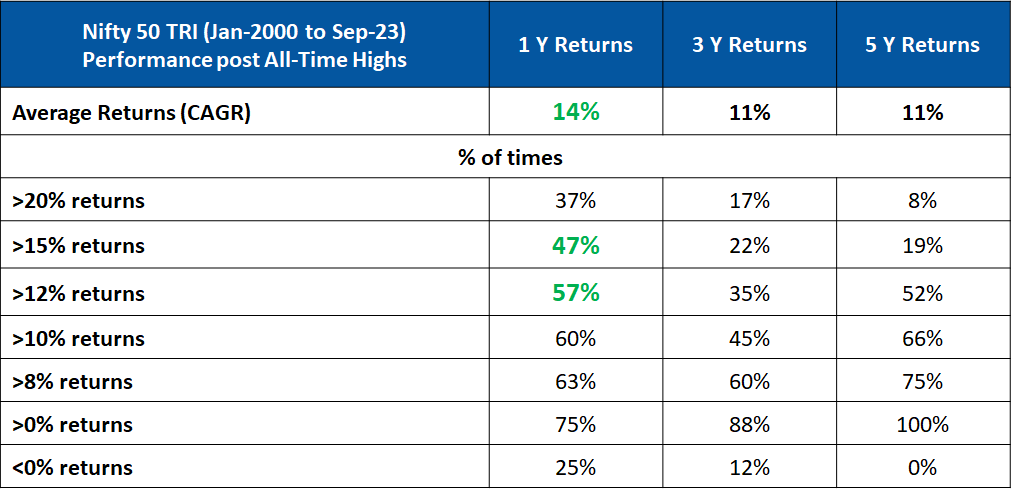
Level 5 – Bull market mistake 2: Getting scared by all-time highs
Figure 33 (page 271)
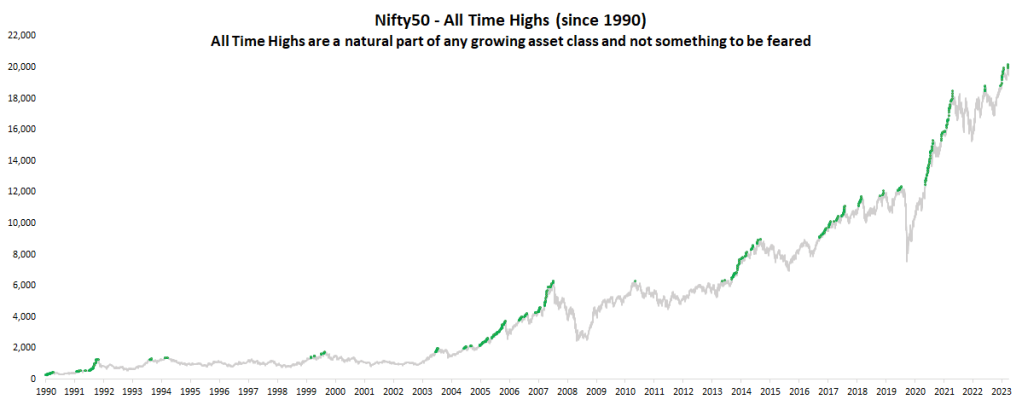
Table 37 (page 272)
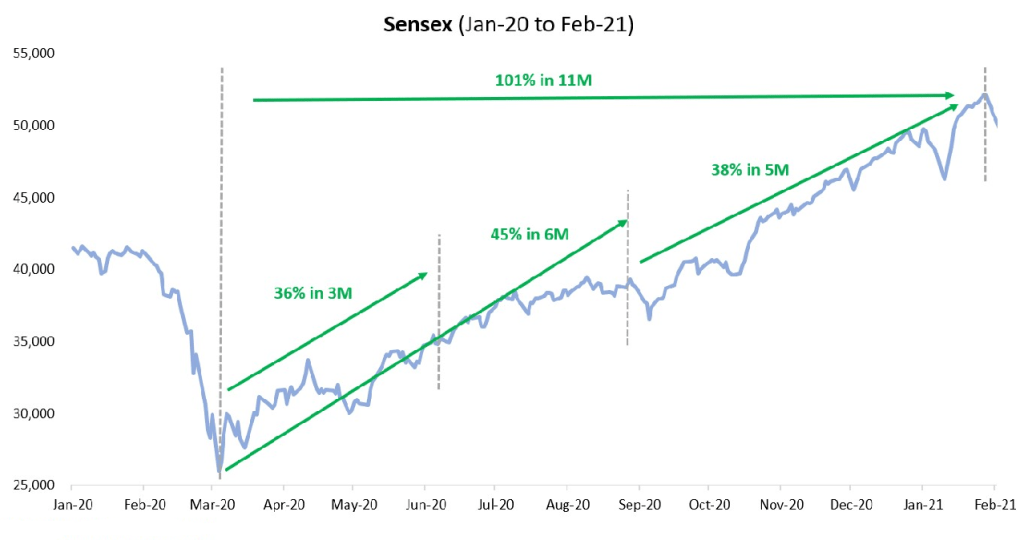
Level 5 – Bull market mistake 3: Selling out at the first sign of bad news or small market correction
Figure 34 (page 275)
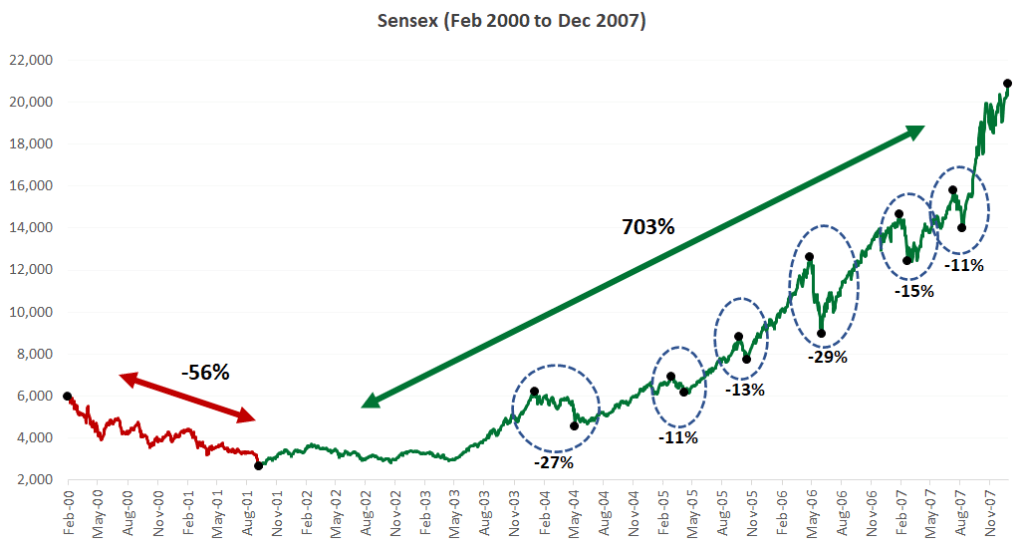
Figure 35 (page 275)
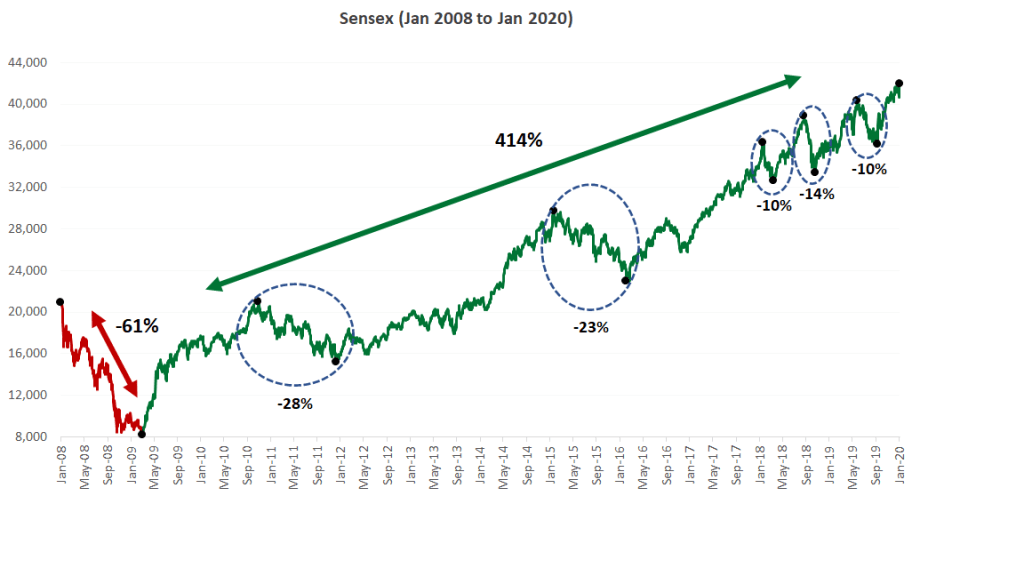
Figure 36 (276)
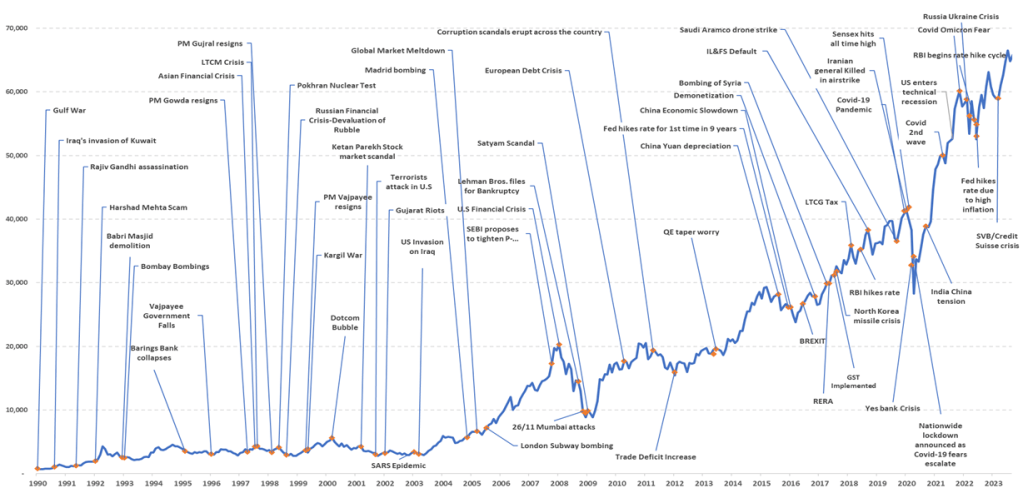
Figure 37 (page 276)
Level 5 – Bear market mistake: Trying the exit-now-and-enter-later strategy in the middle of a bear market
Figure 39 (page 286)
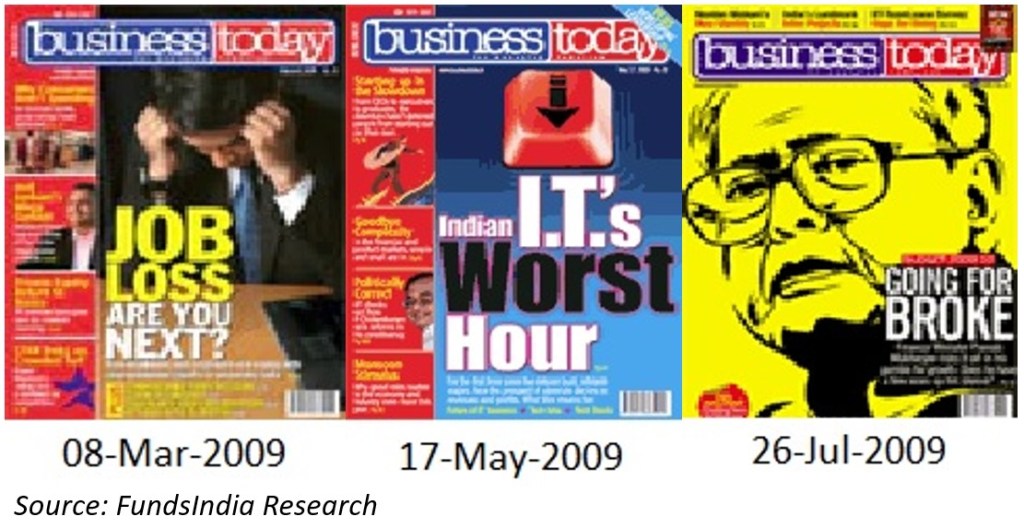
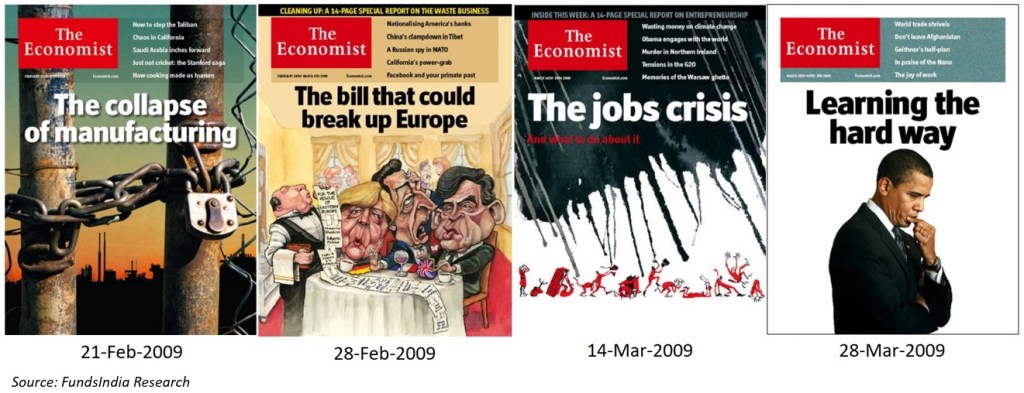
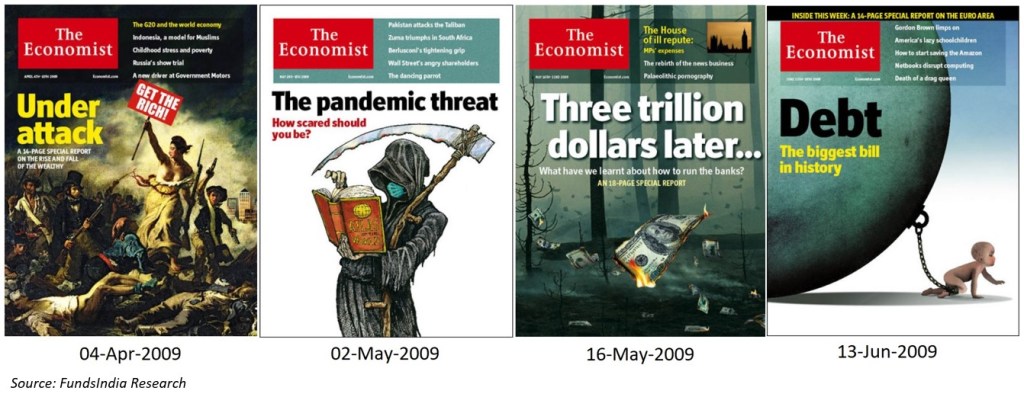
Figure 42 (page 288)
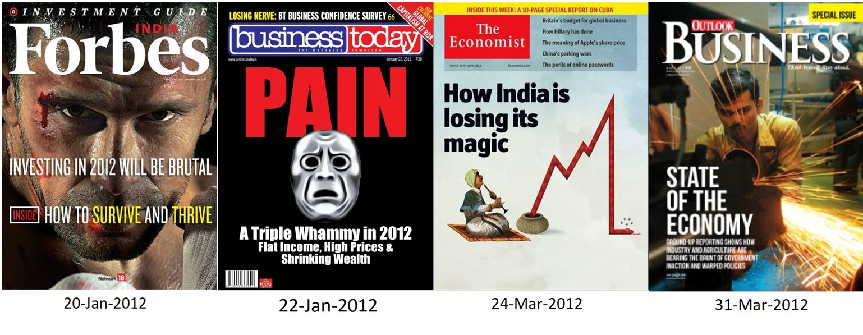
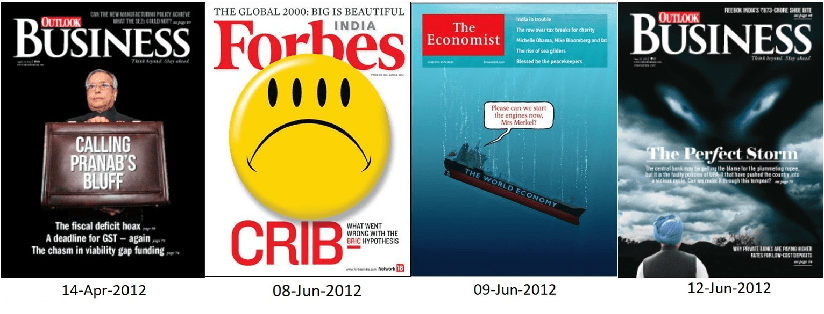
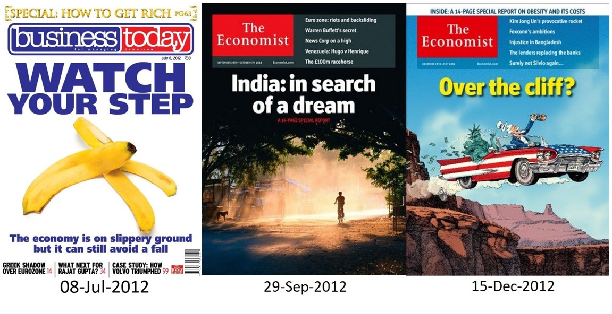
Figure 43 (page 289)
source: whiteoak capital
Figure 44 (page 290)
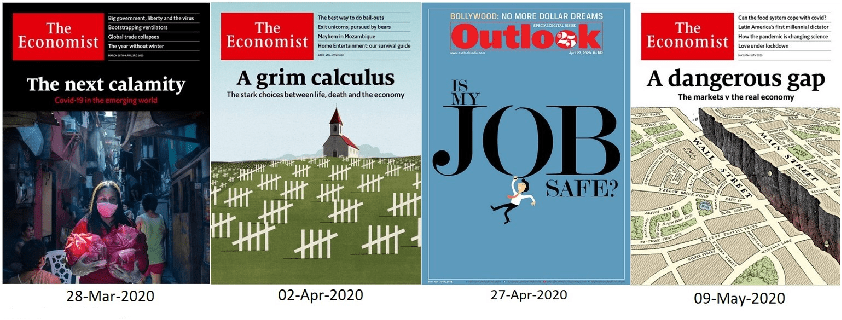
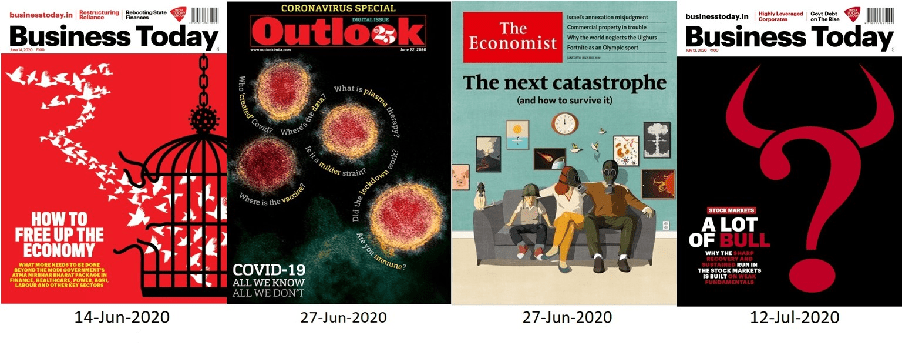
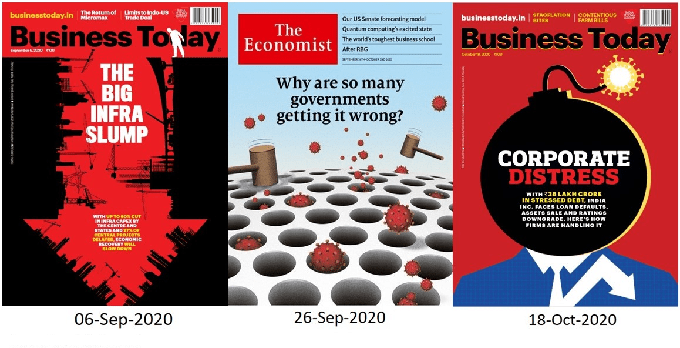
Figure 45 (page 291)
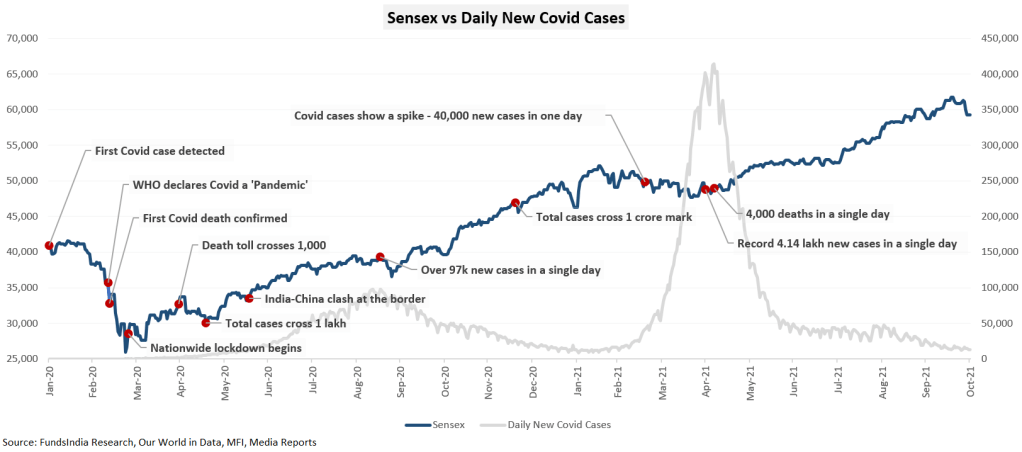
Figure 47 (page 293)
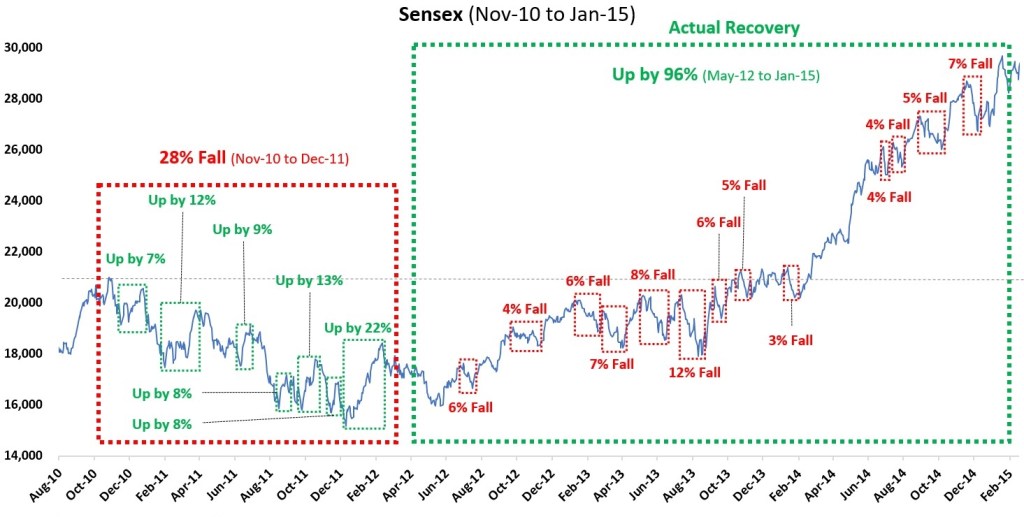
Figure 48 (page 295)
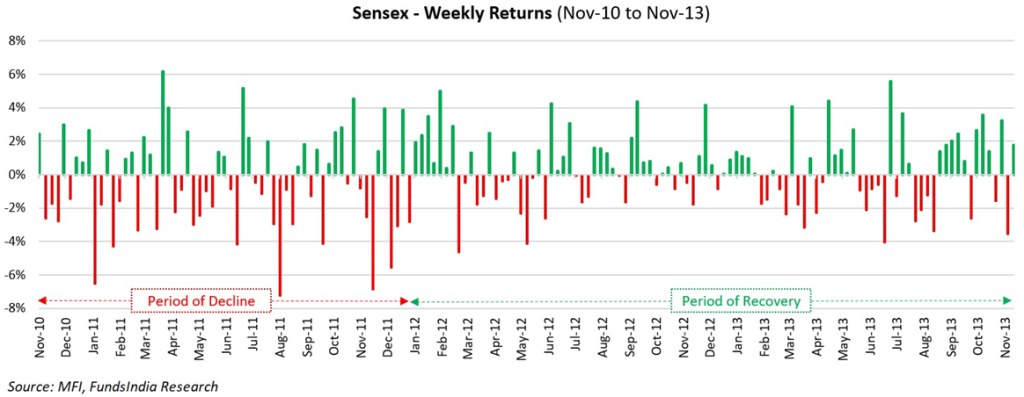
Figure 49 (page 295)
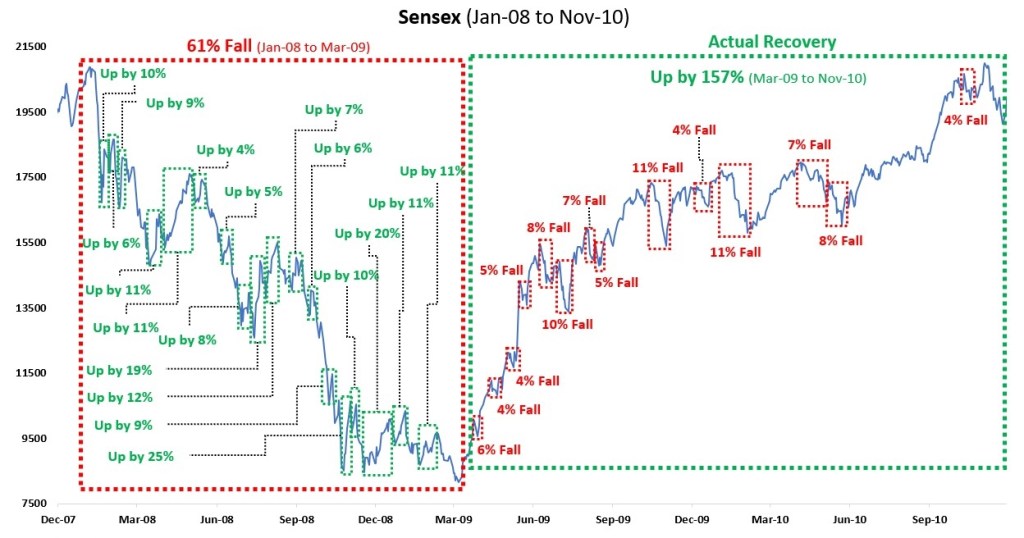
Figure 50 (page 296)
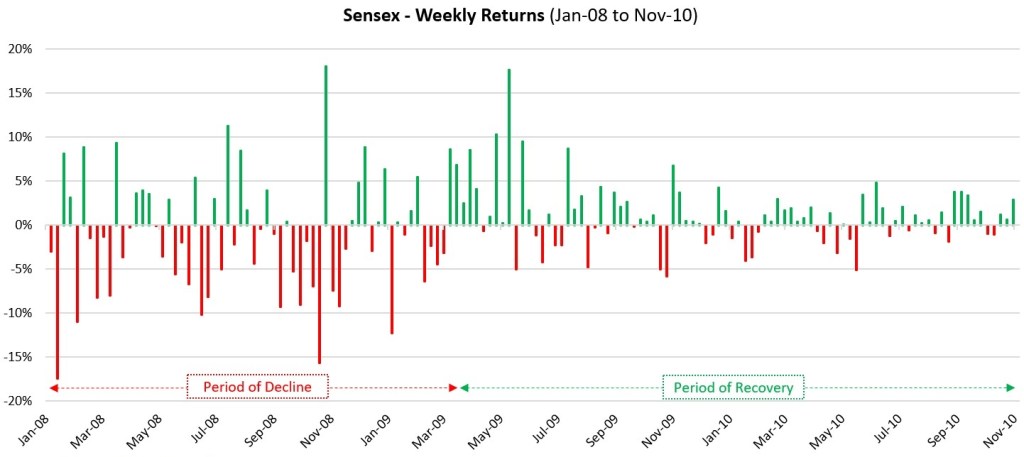
Figure 51 (page 297)
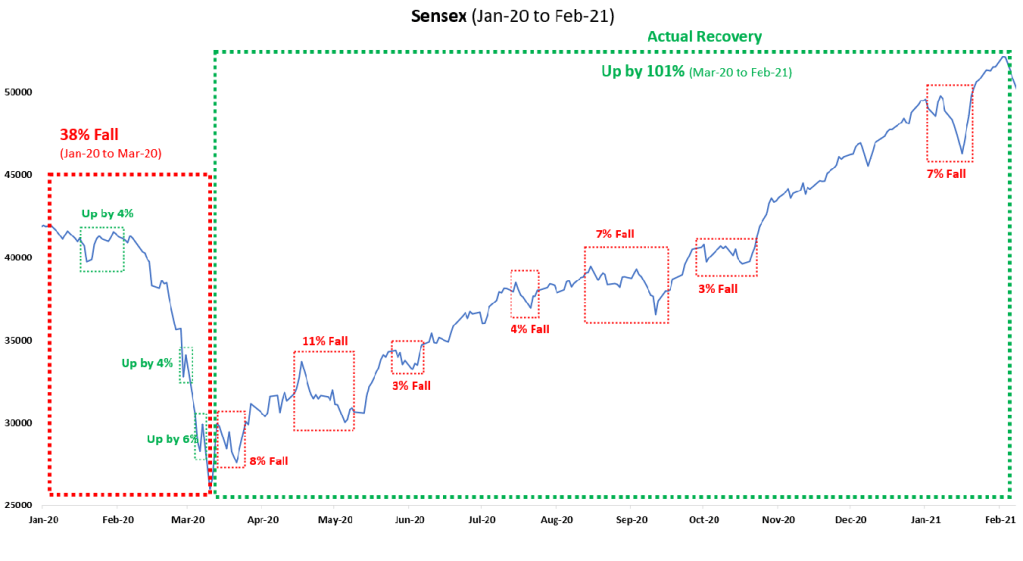
Figure 52 (page 297)
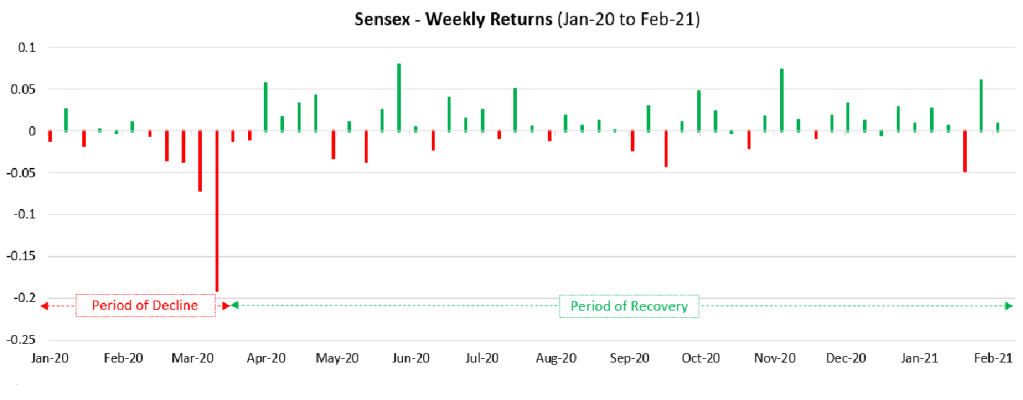
Figure 53 (page 302)
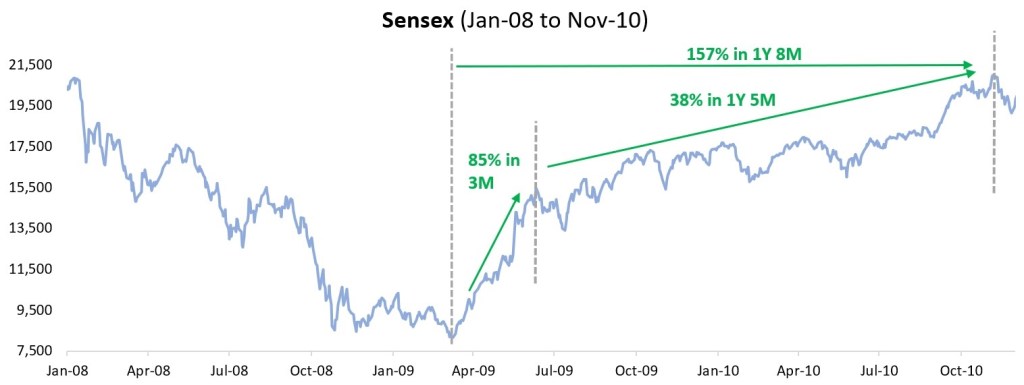
Figure 54 (page 303)
Level 5 – Product Selection mistake: Selecting products based only on past returns
Figure 55 (page 306)
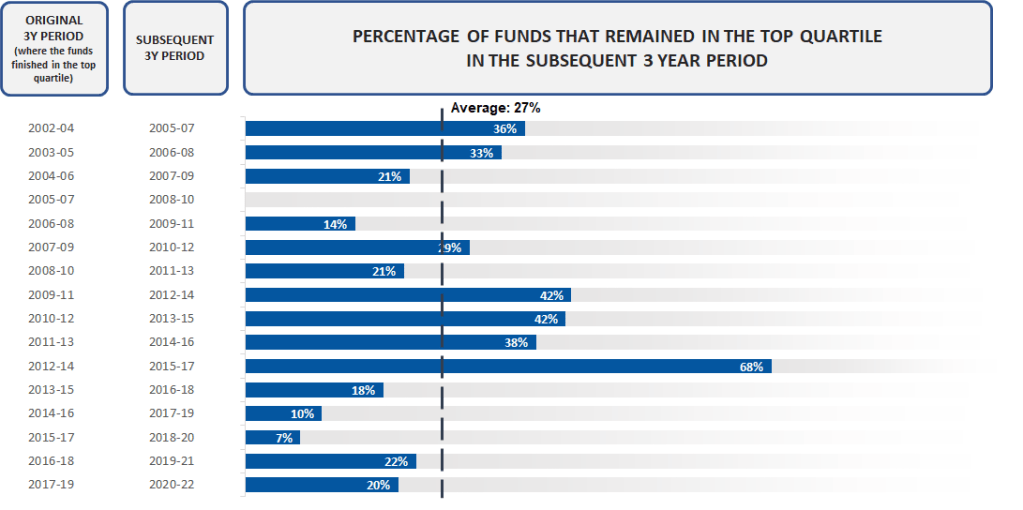
Table 38 (page 306)
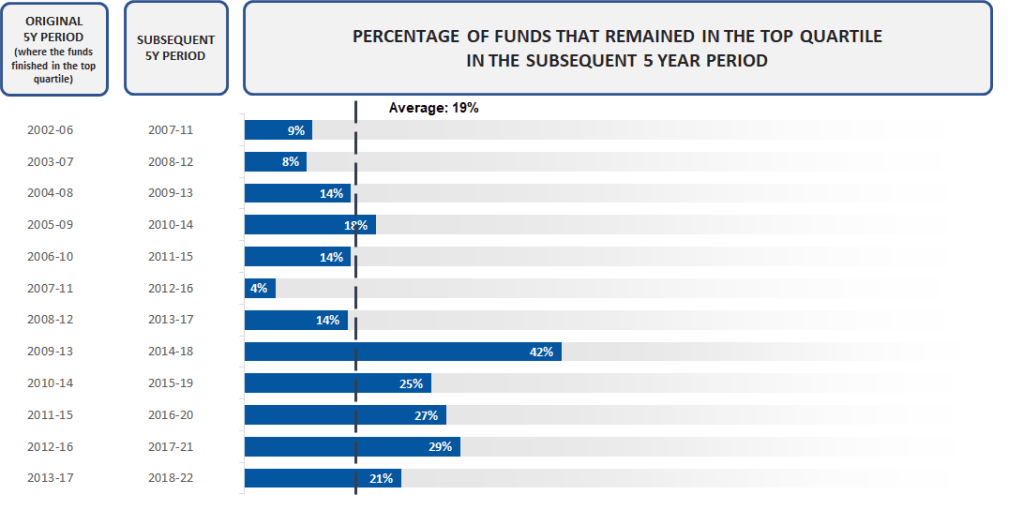
Table 39 (page 307)
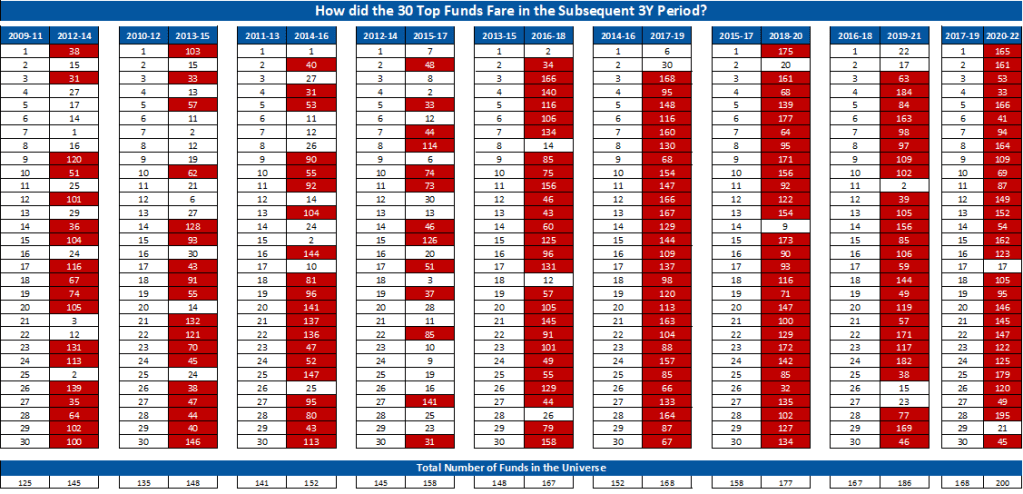
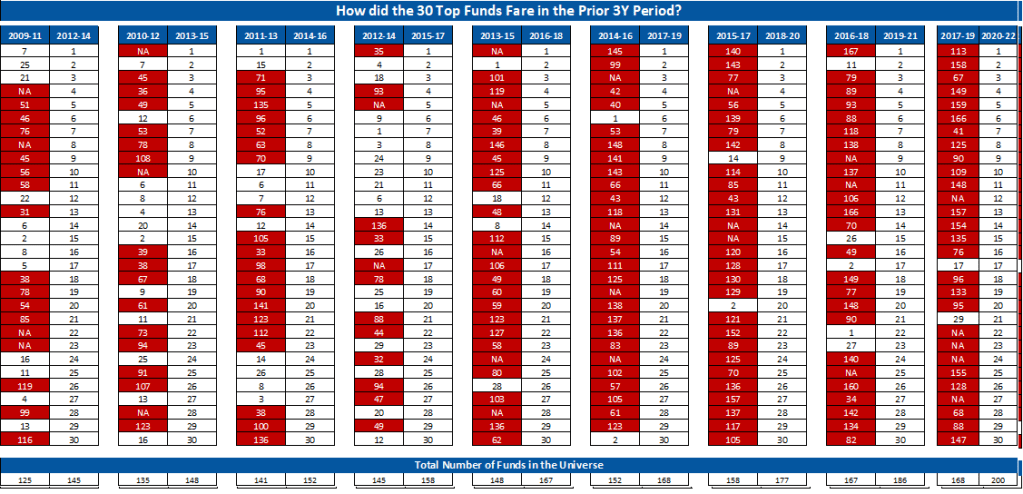
Table 40 (page 308)
Table 41 (page 309)
Figure 56 (page 309)
Table 42 (page 310)
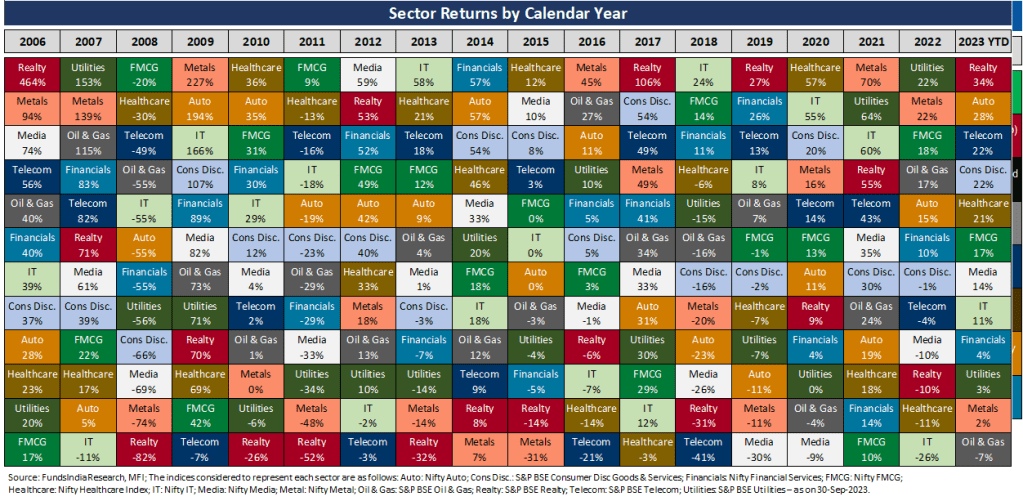
Table 43 (page 310)
Level 5 – Three common phases of failure for equity SIP investors
Table 44 (page 320)
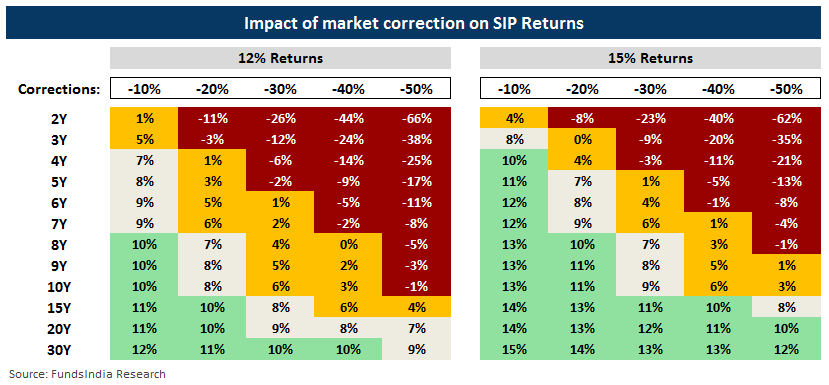
Figure 57 (page 321)
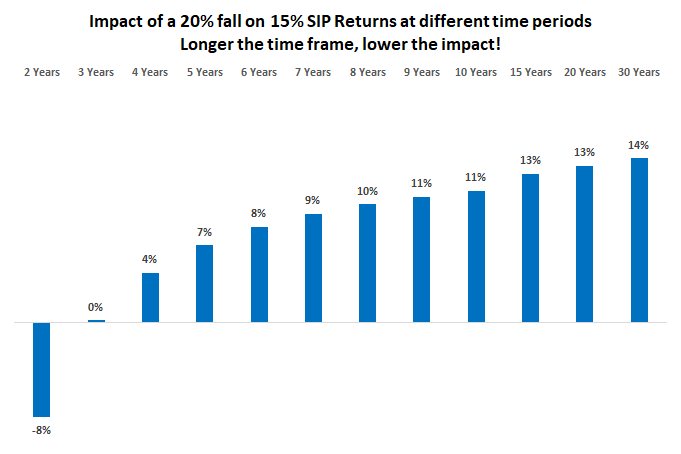
Table 45 (page 322)

I will also be updating the visuals with the latest numbers every year in January.
Happy Investing as always and don’t forget to order the book 🙂

Fantastic tables. Thanks a lot for this article.
LikeLike
Nice
LikeLike