

Backdrop
I have been running a live Equity SIP portfolio with the simple intent of motivating you to start yours.
If you are new to SIPs and want a clear understanding of why and how this whole stuff really works check my earlier article here.
Here is how it was done:
- Rs 30,000 per month since Aug-2018 till Jul-19
- Rs 40,000 per month since Aug-2019 till Jul-20
- Rs 50,000 per month since Aug-2020 till Jul-21
- Rs 60,000 per month since Aug-2021 till Jul-22
If you are interested in how it all began, you can read the story here.
Now if you don’t have the time to read the original post, here is the plan in a nutshell…

You can check the previous reviews below
- 6 Month review: Link
- 1 Year review: Link
- 1 Year 6 months: Link
- 2 Years: Link
- 2 Years 6 months: Link
- 3 Years: Link
It’s been three and half years and time for our half-yearly review!
Checklist
- Did you invest every month?
Yup! - Did you increase the savings amount after every year?
Yup! Last August (2021), I increased my SIP amount by 10K (from 50K to 60K) exactly as per plan. - Do you have a long time horizon to even out the ups and downs?
Yup. 10-15 years easily. - Does the overall performance fall within your 6-month expected return range?
- Any change in fund manager?
- Did the fund manager stick to the stated investment style?
- Does the original investment rationale hold?
- Do they continue to communicate their strategy?
- Is the churn low?
- Is the expense ratio reasonable?
- Fund Performance
- Risk
Let us address the questions from 4-12
Performance Check
One of the biggest issues when it comes to performance evaluation is that we are sold equities with the wrong expectations. Mostly the pitch is 12-15% returns over the long run.
So anytime, the performance is below the expectation of say 12%, we worry that “Hey! Maybe this is not working. So let me stop my SIP”.
Historically, when I studied the past SIP journeys, I found that all SIP investors have to go through three tough phases at regular intervals.
- Disappointment Phase: There are intermittent periods of time where your SIP returns are between 7-10%. While this is not a bad outcome and is better than FD returns, as an equity investor you definitely expected a lot more from your equity SIP. This phase is characterized by the typical “I expected far more” rant.
- Frustration Phase: There are intermittent periods of time where your SIP returns are between 0-7%. This is much lower than what you would have got in your FDs. This phase is characterized by the typical “My FDs would have done far better” rant.
- Panic Phase: Whenever there is a large temporary market fall, which is pretty normal for equity markets (Using history as a guide, a 10-20% fall happens almost every year and a 30-60% fall can be expected once every 7-10 years), your SIP returns may even turn negative for a short period of time. As you see your hard-earned money eroding every day, eventually panic takes over and you decide to stop and redeem your entire SIP money. This phase is characterized by “My Portfolio value is even lower than what I invested” rant.
Here comes the tough realisation – All the above phases are actually a feature and not a bug.
Whenever equity returns were low i.e when it hits one of the three failure points in the initial 3-5 years, as blasphemous and counterintuitive as it sounds, patiently continuing your SIP for another 1-3 years led to a dramatic recovery in performance!
If you find this a little difficult to believe, you can read about why this happens and the entire thought process here.
So the reality is that the long term is simply made up of several short terms where the returns have a wide range of outcomes. As several short-term periods accumulate, the wide range of ups and downs even out to provide reasonable returns.
We needed a framework, to make sure short term expectations were set right so that we can hang on for the long run.
Now in the last review, based on the 6-month expectations framework that I discussed in that post, the expectations were…
In the next six months, that is on 04-Feb-2022,
I would expect my portfolio (actual investments of Rs 18 lakhs) to be between Rs 20 lakhs to Rs 40 lakhs. This would be considered normal behavior for my portfolio.
Let us check the results as of 04-Feb-2022,

Great! The value Rs 29.5 lakhs is within our expected range. Equity asset class is behaving normally as per my expectation and as we continue investing over longer time frames, the returns will be decent.
Overall the performance was better than the benchmark index Nifty 500 TRI, Nifty 50 TRI, and Nifty Next 50 TRI as seen above.
So both the asset class and fund selection are working out as expected. The key is not to get too carried away by the higher than expected current returns and let us continue to focus on the process and keep things simple.
Now with that out of the way, let us dive into the two funds…
Fund 1: Parag Parikh Flexicap Fund
You can refer to the original rationale here

Latest Factsheet (as on 31-Mar-2022):
High Conviction
Original Rationale: The entire fund house just has one single equity fund – and this single fund runs a concentrated portfolio of around 20-25 stocks. So all the resources will be focused on this single fund and shows their conviction and belief. This is a welcome change from the majority of AMCs where they have several funds running different strategies so that at all points in time there will be one fund or the other performing.
Current View: Logic pretty much continues to hold true. As explained in previous reviews, they have launched an ELSS fund. But this will be very similar to the Parag Parikh Long Term Equity Fund except for the global exposure (which again is because the regulation doesn’t allow global exposure for ELSS category)
Skin in the game
Original Rationale: Their own employees own around 10% of the scheme
Current View: While this has no prediction capabilities on the future performance, this is a sign that we are partnering with people of integrity and the intention will be to do the right thing as their money is also invested.

Currently 156 crs (i.e ~0.7%) of the fund is owned by company employees. While it optically looks like the ownership is coming down, this is because the fund size has also grown. As more outside investors like us invest in the fund their ownership comes down.
Focused & Simple to track
The current portfolio has around 25 stocks and is very easy to track.
Clear Communication
Original Rationale: These guys are way ahead of the industry and have phenomenal transparency in communicating their views and process. They have a good youtube channel (link) where the fund managers regularly communicate their views and also their annual investor meeting is available where they talk about the investment thesis behind their stocks.
Current View: They continue with their frequent communication via their youtube channel.
Investment Process & Style
You can find them discussing details on their investment philosophy and thought process here
The portfolio remains more or less the same with minor changes and the earlier discussed thesis continues.
There were:
3 New additions to the Portfolio: Power Grid, Motilal Oswal Financial Services, Cipla
4 exits from the portfolio: Persistent, Mphasis, Cadilla, Lupin
Low Churn
The churn is very low at 16% indicating that they are walking the talk of a buy and hold strategy.
Fund Managers
The fund managers Rajeev Thakkar and Raunak Onkar continue to manage the fund which was my original thesis. So no worries!
Exposure to global stocks
The fund provides diversification via 1/3rd exposure to global stocks. The global equity exposure remains around the same levels at ~29% (vs 29% six months back).
Expense Ratio
Their expense ratio has consistently been coming down.
Their expense ratio when I started was around 1.4%. It has been consistently coming down. During the previous review, it was 0.87%. Now it remains the same at 0.87%. This is great. The lower the cost the better for us!
Performance
Here is how the fund has performed in the past

As seen above, the 5Y & Since Inception (roughly 9 years) performance indicates significant outperformance against the benchmark. The fund is doing good as per my expectation.
Cash Allocation
In 2019 they had cash allocation of around 14%. I personally don’t prefer fund managers taking cash calls and hence had mentioned this as a concern. But as the markets corrected in February and March 2020, they had deployed the entire cash into equities.
Right now the cash allocation is around 5% and this is pretty normal and no worries as of now.
Overall View
Overall, my thesis remains intact and I will continue with my SIP in Parag Parikh Flexicap Fund!
Fund no 2: ICICI Prudential India Opportunities Fund

The primary thesis (refer here) was based on the fund manager Naren. Here is a snapshot of why I like him
- 30+ years of Market experience covering 3 cycles
- 15+ years of fund management experience
- Robust long term performance track record
- Consistent Investment Style = Value investing + Contrarian + Evaluating Cycles + Top Down (using the big picture to arrive at stocks to invest in) + Bottom Up
- Macro overlay + takes advantage of cycles
- Knowledge of credit markets and credit cycles – its interplay with equities
- Ability to withstand and stick to investment process during occasional periods of short term under performance
- Widely read
- Investment Gurus – James Montier, Howard Marks, Michael Mauboussin
- Deploys checklists for investing – inspired from Atul Gawande’s Checklist Manifesto
- Communicates strategies and thought process regularly on public forums (making our lives a lot more easier)
To play the contrarian style, you need to be willing to look wrong often in the short term, before the mean reversion takes place. This means you need the support and trust from both the AMC and investors. Naren’s experience and stature allows him the rare luxury to take near term pain and stay patient till the contrarian call plays out (which a lot of new fund managers will never have as the short sighted industry won’t let him/her survive)
Portfolio Positioning of ICICI Prudential India Opportunities Fund
It is a top-heavy concentrated fund with top 10 stocks accounting for 64% of the portfolio and 15 stocks accounting for ~75% of the portfolio. Overall it has around 44 stocks.
AUM size at Rs 4,911 crs implies significant flexibility to manage the portfolio across market caps.
Currently, the portfolio has around 28% in Mid and Small caps vs 38% exposure 6 months back.

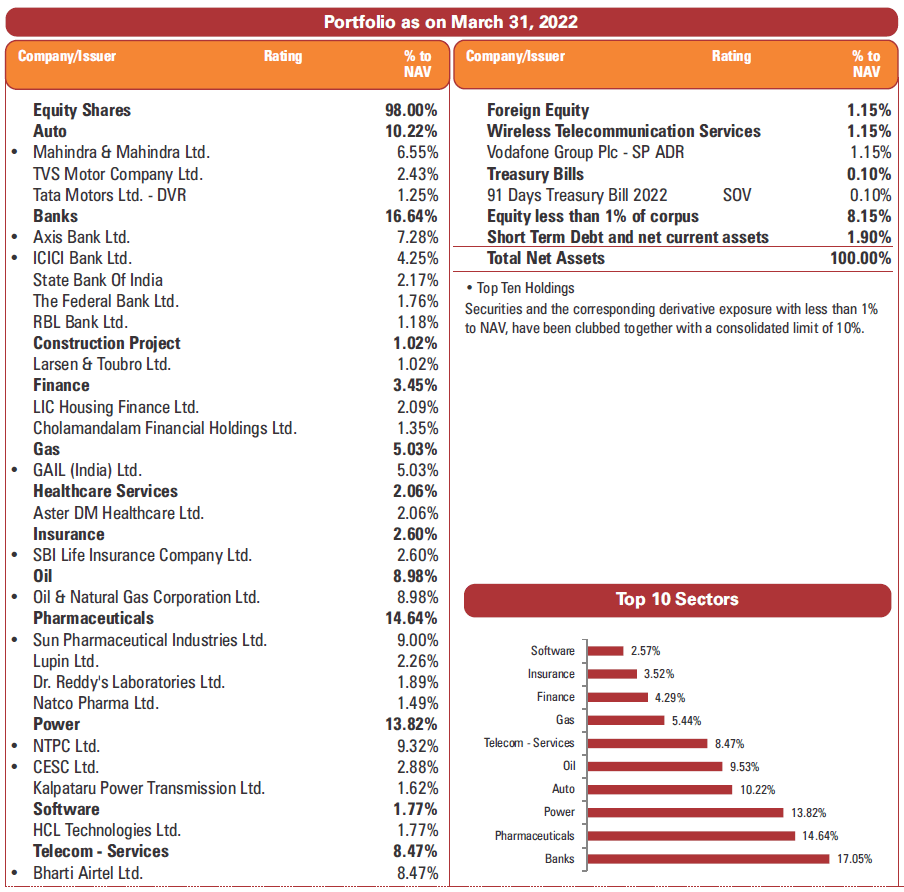
Sector Views
Investments were predominantly into sectors which were going through near term pain thereby providing attractive valuations. Some of the positions have already started to play out. The portfolio is positioned for cyclicals and can do extremely well if the economic recovery continues.
Overweight:
- Pharma & Healthcare – 17% – Sun Pharma, Lupin, Dr Reddy, Natco, Aster DM Healthcare
- Power – 14% – NTPC, CESC, Kalpataru Power Transmission
- Corporate Oriented Lenders – 16% – Axis, SBI, ICICI, Federal Bank etc
- Auto – 10% – M&M, TVS, Tata Motors
- Telecom – 10% – Bharti Airtel, Vodafone Group
- Oil & Gas – 14% – ONGC, GAIL
- Positioned for Cyclical recovery
- 28% Portfolio Exposure to small and midcaps
Underweight: Retail Lenders, Consumption, Quality theme + Came entirely out of Metals in the last 6 months (7% exposure in the last review)
Valuations
Price to Earnings Ratio: 12.6 (vs 14.4 in previous review)
Price to Book Ratio: 1.6 (vs 1.7 in previous review)
(source: value research)
PE ratio at 12.6 times is also reasonable – providing significant valuation re-rating potential.
This is something I will monitor to get a sense of the value orientation of the portfolio.
Skin in the Game
As per the data shared by Manoj Nagpal in his linked post here, the AMC board has around Rs 54 crs and Naren has around 52 crs invested in this fund. This is the highest exposure by the ICICI Prudential AMC board and fund manager compared to all other ICICI Prudential Equity Funds.
This provides me with further comfort as even the AMC and the fund manager are betting on this fund. As always, more than what they say, the real clues are always hidden in what they do.

Expense Ratio
The expense ratio is around 0.62% ( 0.56% in Aug-21) which is still pretty low and good!
Portfolio Churn
Portfolio Churn is neither too high nor too low at 59%. Given the part tactical nature of the portfolio, I expect this to be around this range.
Performance
The fund was launched on 15-Jan-19 and hence has a short performance track record.
What was my view before 1 and half years…
The performance at that point in time was nothing to write home about. To be honest it was really bad.
This is what I wrote in my review back then:
This is in line with all value oriented fund managers under performing. If you notice all the celebrated value oriented fund managers before 2013 – Prashant Jain, Anoop Bhaskar, Quantum Mutual Fund, Sankaran Naren, Anand Radhakrishnan etc are underperforming big time. The new breed of Quality oriented fund managers have been strong performers in the last 7 years. I expect mean reversion to play out sometime similar to what happened to value oriented fund managers previously and the quality oriented managers to go through their lean patch.
What happened in the last 1 year
Post that there was a significant pick-up in returns (not that I knew about the timing) and thankfully the thesis has started to play out. Due to the strong returns in the last 1 year, now the fund has started to outperform both in the 3Y time frame and Since inception (15-Jan-2019). This is yet another reminder of why patience is a must when you take part in contrarian funds.
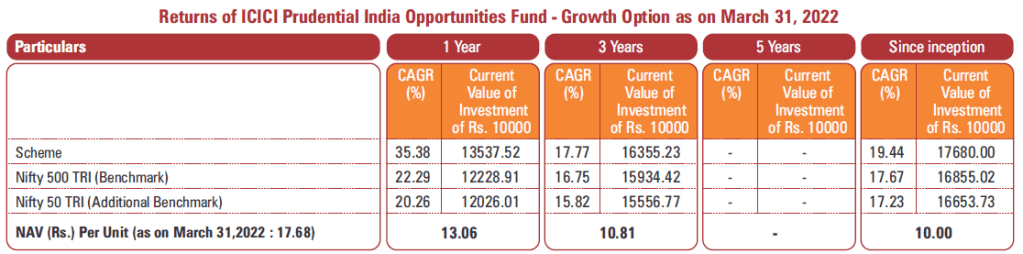
That being said, this fund is not for the fainthearted and will have a significant performance differential with indices in the short term (negative and positive) given the divergent and concentrated portfolio of beaten-down stocks.
Overall View
Overall, my original thesis remains intact, and I would want to play the contrarian style via Sankaran Naren.
Things Under My Control – Time & Discipline
Now while I have no control on the markets, the biggest determinant of my future portfolio thankfully is still under my control – Time + Discipline
Time – I have easily 10-15 years time frame. This would take care of most of the near term volatility and I can ride it out.
Discipline – To save and invest consistently, come what may. Call it the pressure of social accountability, I have managed to invest Rs 30,000 every month for the first 1 year, Rs 40,000 every month for the 2nd year, Rs 50,000 every month for the 3rd year. Now for the current 4th year, I have been investing Rs 60,000 equally split across both the above funds.
I continue to focus on the above two – Time and Discipline and hopefully in 10-15 years should have a good enough outcome
Next 6 Month Return Expectation
I had discussed a new framework to set expectations for equities as an asset class here.
The rough math goes like this,
For a 6 month SIP of Rs 10,000 (i.e an investment of Rs 60,000 in total) – the portfolio value usually (read as 95% of the times) has ended up in the range between Rs 50,000 to Rs 80,000.
The worst ever value has been at Rs 40,000.
The above value has been calculated using Nifty (from the year 1990)
So for my Rs 60,000 SIP, I expect my portfolio to be normally between Rs 3 lakhs to Rs 4.8 lakhs after 6 months.
But I have already accumulated around ~Rs 29.5 lakhs as on 4-Feb-2022 (Just to make sure the six month review time lines are kept the same).
This Rs 29.5 lakhs is like a lumpsum amount going forward as the entire amount is exposed to equity market ups and downs. So, while the next six month SIP of Rs 60,000 normally will give me between Rs 3 to 4.8 lakhs , we also need to figure out the 6 month 95% probability range for my Rs 29.5 lakhs which has already been accumulated.
Based on historical data, the 6 month 95% probability return range for equities has been anywhere between -26% to +52%. Applying this to Rs 29.5 lakhs we get a 6 month outcome range of Rs 22 lakhs to Rs 45 lakhs
So adding both we can get our normal range of expected outcome for the next 6 months.
In the next six months, that is on 04-Aug-2022,
I would expect my portfolio (actual investments of Rs 21.6 lakhs) to be between Rs 25 lakhs to Rs 45 lakhs. This would be considered as normal behavior from my portfolio.
That being said, if there is a large market crash (which I obviously can’t predict), then my portfolio can fall much more than this. It is reasonable to expect one or two major crisis events every ten years. (the covid crash of 2020 is a good reminder of this)
I have a 10-15 year time frame for my SIP. This means I have 20 to 30 six month periods to stay invested. Even if I lose out on a few periods, going by history of equities, majority of six month periods will be in my favor and hence I get to experience better returns over the long run.
In a similar manner, you can start building reasonable volatility expectations over the next 6 month period for your SIP portfolio.
The key idea is to stay for long term returns, one six-month period at a time!
Summing It Up
The whole idea is not to ask you to pick these 2 funds. That is irrelevant. The actual intent is to encourage you to save and invest steadily across your working careers. 10-15 years down the line, irrespective of which fund you pick (as long as you don’t mess it up big time) you will end up with a great outcome.
I honestly think if we plan our money well, then it can make a huge difference to our lives and the people around us. The idea behind this blog is that in a small way, if I can help you make good money decisions today, maybe I can someday create a big difference in your lives.
Ok, sentiments aside – the next review will be on Aug-2022.
See you, folks. As always Happy investing!
If you have any feedback you can also mail me at rarun86@gmail.com.
If you loved this post, share it with your friends and don’t forget to subscribe to the blog (1 article per week) or Twitter along with the 9000+ awesome people. Look out for some fresh, super interesting investment insights delivered straight to your inbox.
You can also check out my other articles here
Disclaimer: All blog posts are my personal views and do not reflect the views of my organization. I do not provide any investment advisory service via this blog. No content on this blog should be construed to be investment advice. You should consult a qualified financial advisor prior to making any actual investment or trading decisions. All information is a point of view, and is for educational and informational use only. The author accepts no liability for any interpretation of articles or comments on this blog being used for actual investments.

Thanks for post Did you consider costs in comparison to indices. If not , please do and publish comparison tables All your funds will disappoint you
LikeLike
The comparison table is including all the costs!
LikeLike
Hi
Wow…33.5% with SIP… I have been following you with PPFAS fund only cause I was not convinced with the value style. This may be because I have entered markets in late 2017.
Your original article (where you selected funds) and today’s article (performance) needs to reach out to retail investors. This is the proof that equity markets can deliver amazing results to retail investors. I have recommended your blog to many friends. Your work is amazing.
LikeLike
Thanks a ton for the kind words 🙂
LikeLike
I think the key to success lies in, first, your selection and conviction of/in a good performing scheme from a good mf house and then wait patiently for 5 years to give you a good return.
LikeLike
thanks for the post, very well documented and very helpfull
LikeLike
This is so useful. Chronicling your journey, your thought process and facts makes this a very insightful article for mutual fund investors. Well done!
LikeLike
Hello Arun, happy to see that your funds are doing well.
I have a question –
Is there an app where I can enter invt trxns, track my portfolio returns, volatility plus some statical data.
LikeLike
Good read Arun.
When is update coming?
LikeLike