

- Fixed Deposits
- Fixed Income
- Gold
- Real Estate
- Equity
Let me also start with an honest disclaimer – it is impossible to exactly foresee what returns the above asset classes will generate over the next 10 years. But in order to plan for our financial needs and goals we need to have an approximate idea on what to expect from each of these asset classes and the possible risks embedded in them.
“It is better to be approximately right than precisely wrong”
John Maynard Keynes
A good place to start is to find out how these asset classes have performed in the past.
Fixed Deposits:
The asset class is probably one of the safest investment options as we exactly know the return we will make.
 Source:RBI
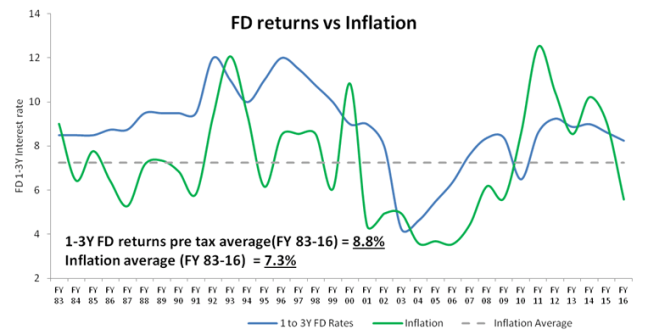
As seen from the chart, Bank FD has averaged around 8.8% in the last 34 years vis-a-vis inflation which is around 7.3%. On the first glimpse, it looks like F.D’s have done a decent job of staying slightly ahead of inflation and thereby ensuring that our purchasing power is preserved (i.e if you save some money instead of buying a car, then that money if it grows close to inflation will ensure you can buy the same car again – a better car if you can generate more than inflation and a lower grade car if your returns are lower than inflation). We can observe that long term returns from investing in Fixed Deposits are generally close to the Inflation rate.
But however there is a small problem – Fixed deposit returns that come to your hand is much lesser as taxes eat away a portion of your returns.
Interest earned from Fixed deposit’s are taxed based on the income tax slab which you belong to. So the post tax returns (read as the returns that you actually receive in hand) is actually much lower than the fixed deposit rates that are being advertised.
Let’s see how the earlier chart changes if you adjust for the taxes

![]() Source: RBI and Cost of Inflation Index
Source: RBI and Cost of Inflation Index
Both 30% and 20% Income tax payers have actually made returns less than inflation or in other words they would have been better off spending the money in the first place rather than saving.
Refer to the below table to find out how much you are actually getting from a fixed deposit scheme
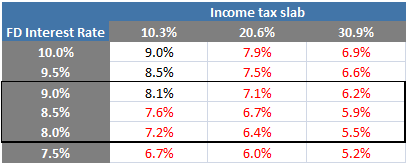
*3% cess added to tax rates of 10% 20% and 30%
As seen above, for someone in the 30% tax bracket, at today’s rates of around 8 to 8.5% he will be able to get only between 5.5 to 5.9% actual post tax returns. This is lower than the long term inflation of 7 to 8% thereby implying that you actually lose your purchasing power if you invest in F.Ds.

If you are in the 30% income tax bracket, for every 1 lakh you in invest in an F.D promising you end up losing Rs 29,000 every ten years assuming an inflation of 7.5%..Phew !!
So when it comes to F.Ds don’t fall for the advertised returns. Calculate your relevant post tax returns. If it works out to be less than 7-8% (or whatever is your expected inflation no) then avoid it as you are actually losing your purchasing power in the long run. F.D returns are extremely poor especially for people in the 20% and 30% tax bracket. While my suggestion is to “avoid F.D” completely, if you are too big a fan of it then use it only for your investments which are less than 3 years.
(to be continued)

Well explained.. you are genius 🙂 . I dont know , I always had difficulty in calculating income tax for fd . It’s so simple now 🙂
Yep simple maths ..
LikeLike