
When investing in equities, the most common question is “what returns will I get?”. As seen in the earlier post (Link), equity returns are extremely volatile in the short run (sample this- the 1Y returns for Sensex has ranged from 256% to -56%) and tend to become less volatile with increasing time frame. In order to have an idea on what returns to expect, first and foremost, we need to understand the drivers of equity returns.
Let me use Sensex as a proxy for equities. The value of Sensex can be broken down into its two components:
Sensex Value = Profit of underlying companies * Valuation (i.e no of times the profit that you are willing to pay)
or in exact geek terms it reads as
Sensex Value = Earnings Per Share for Sensex * PE Ratio
- EPS (Earnings per share for Sensex) represents the underlying profits of the Sensex companies
- PE Ratio (Price Earnings Ratio) – This is the valuation or the no of times the underlying profit that the investors are willing to pay
The key takeaway here is that the Sensex value can be alternately viewed as the product of two numbers -EPS and PE ratio. So when we want to evaluate future returns for equities we are essentially asking the question “How much will the sensex value change?” or in other words “How much will the eps and pe ratio change? “
Change in Sensex value = Change in EPS * Change in PE Ratio
So from now on, every time we decide to invest in equities we must essentially try to answer two questions
- What can be the earnings growth for the next 5 years?
- Will the valuations move up (increasing returns) or move down (reducing returns) or stay flat (not contributing to returns)?
What can be the earnings growth for the next 5 years?
Now as I have always stated, I don’t think anyone can exactly predict the future earnings growth. In fact, most of investing is about the future and the future always remains uncertain !!
But the paradox is that, we need to have some sense of the possible earnings growth in order to set some reasonable expectations on equity returns. So how do we solve this catch-22 situation.
The answer lies in a simple yet profound statement from one of the greatest investors Howard Marks
“Just about everything is cyclical“.
Instead of me explaining. Let us listen to what Howard Marks has to say..
I think it’s essential to remember that just about everything is cyclical. There’s little I’m certain of, but these things are true: Cycles always prevail eventually. Nothing goes in one direction forever. Trees don’t grow to the sky. Few things go to zero. And there’s little that’s as dangerous for investor health as insistence on extrapolating today’s events into the future.
Always remember:
Rule 1: most things will prove to be cyclical
Rule 2: some of the greatest opportunities for gain and loss come when other people forget rule number
If you find time, do read his letter – Link
Let’s check the historical earnings growth for Sensex

Source: MOSL
You can clearly see that Sensex earnings growth has remained cyclical and alternates between low and high growth periods.
- FY 93-96 : 45% CAGR
- FY 96-03 : 1% CAGR
- FY 03-08 : 25% CAGR
- FY 08-16 : 6% CAGR
- FY 16-21 : ????
So as seen above, earnings growth tends to move in cycles. While its impossible to exactly predict when a cycle turns from high growth to low growth or vice versa, we can form a view on approximately which part of the cycle is playing out now. So while we don’t predict, we are rather preparing ourselves for an eventual change in cycle by evaluating our position in the cycle.
Now comes the million dollar question – Theory is fine. But how in the world do I find out where in the earnings cycle we are currently ??
Lets start with what drives earnings growth:
Earnings growth = Return on Equity *(1-dividend payout)
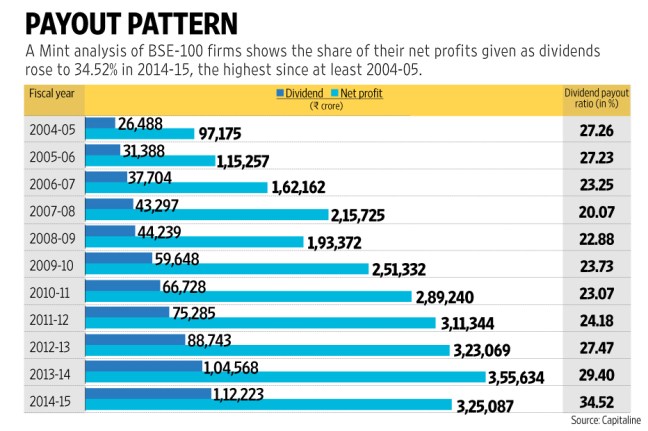
The dividend payout in India as seen below, has roughly been around 25% (Link) and hence we can assume that 3/4 th of ROE or Return on Equity will translate into earnings growth. For eg if ROE averages 20% for the next 5 years, then earnings growth will average around 3/4*20% i.e ~15%. Any additional growth will have to be driven by increasing debt or leverage.
By the way, in case you are wondering what this return on equity is, think of it as the % of returns (profits) which the owners of the business (i.e shareholders) make on the capital invested. For a detailed understanding refer to the below articles Link1 and Link2
Return on Equity can be further broken down into:
ROE = Profit Margin (Profit/Sales) * Total Asset Turnover (Sales/Assets) * Equity Multiplier (Assets/Equity)
In simple terms the equation means you can target a good ROE through:
- A low margin product combined with a high volumes ( think Maruti cars, Fast food restaurants)
- High margin product combined with low volumes (think Mercedes Benz cars, Five Star restaurants/Fine Dining)
- Higher leverage i.e taking a higher debt (relative to shareholder’s equity) as you have more capital in play compared to your own investments ( caveat being your returns from the business is greater than interest rates for debt say >12% at least)
Now that we have come this far, let’s not forget out original intent – to figure out where we are in the earnings cycle – which led to ROE – which further led to profit margin, asset turn over and Debt levels
So now our task is to figure out, where in the cycle are we in terms of profit margin, asset turnover and debt levels.

Source: Capitaline, IDFC Mutual Fund Presentation
The above table shows a glimpse of the data for BSE 500 (Ex Financials) companies. As seen above the ROE is currently at a 15 year low of ~10% versus its 15 year average of 15%. The primary underlying drivers of ROE – Profit Margin and Asset Turnover are also at their 15 year lows.
Profit Margin Cycle:
Let’s first evaluate the profit margin cycle:

Profit margins are currently at a 15 year low. Profit margins have always been cyclical and tend to mean revert over long periods of time. We can clearly see from the above table that in FY15 the profit margin for BSE 500 companies were at historical lows of 5.0% versus the last 15 year average of 7.7% . Hence while we don’t know exactly when it will start to improve we can reasonable assume that the margins are close to their lows and in the next 5 years they should in all likelihood be better.
“Profit margins are probably the most mean-reverting series in finance, and if profit margins do not mean-revert, then something has gone badly wrong with capitalism. If high profits do not attract competition, there is something wrong with the system and it is not functioning properly.” – Jeremy Grantham
Margins improvements will have to occur through these 4 levers.
- Higher operating margins
- Lower interest rates and hence interest charges
- Lower depreciation charges
- Lower direct taxes
So what can possibly be the triggers for profit margin expansion in the next 5 years?
- Higher operating margins – lower costs due to 1)subdued commodity prices 2)possibility of higher capacity utilization leading to fixed costs being spread over a larger sales (think of a flight where % of seats booked improves from 70% to 90% and since most of the costs remain the same, the incremental revenues do not incur corresponding costs thereby leading to higher operating margin. This is also referred to as operating leverage )
- Lower interest rates and therefore interest charges – Interest rates have started to gradually come down led by RBI rate cuts and lower Inflation
- Lower depreciation charges – New capacity is not being created given that the system is still running only at a 70-75% capacity utilisation rate and further the high debt levels also don’t allow borrowings to expand
- Lower direct taxes
Asset Turnover:

Asset turnover is the sales generated by a company’s total assets – this no is at its 15 year low indicating excess capacity, low demand scenario, stalled projects and weak pricing power (negative WPI inflation). This scenario is also expected to gradually improve given the government focus on kick starting the stalled projects and eventual pick up in demand.
Equity Multiplier:
This is probably the only component which will reduce over the next 5 years and hence can have a mild -ve impact on the overall ROE. The last 10 years has been characterized by companies taking up significant debt to expand, put up new capacity etc. In this period the debt equity ratio went up from 0.58 to 1.0. Thus ROE had some positive support from the Equity Multiplier component. However given the high levels of debt and bad shape of the banking system, the debt levels will have to start gradually coming down.
Evaluating earnings growth:
So as seen above, the gist is that – ROE’s over the next 5 years will improve supported by PAT margins expansion and higher asset turnover while the equity multiplier component may slightly pull it down.
So what earnings growth should we expect:
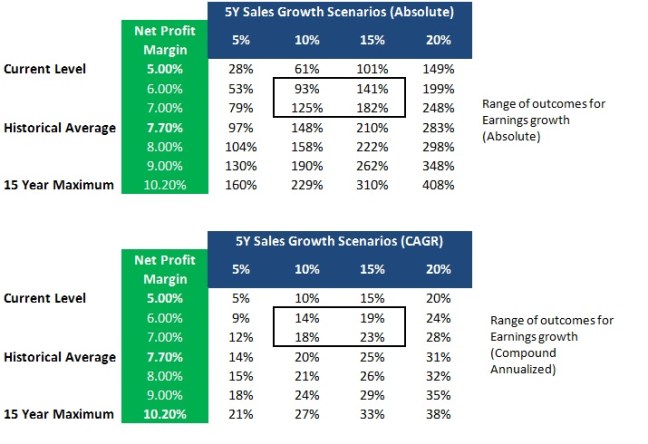
The historical average for Net Profit Margins is 7.70%. Lets make a reasonably conservative assumption that Net Profit Margins will gradually improve to 6 or 7% over the next 5 years from the existing 15 year low of 5.00%. Sales growth is generally in line with Nominal GDP growth (real GDP growth + Inflation). So assuming a real GDP growth of around 6-7% and Inflation of around 5-7% we can expect Net Sales to grow between 10% to 15%.
Conclusion
Hence plugging these assumption ranges, my expectations for earnings growth is around the range of 14% to 23% CAGR over the next 5 years. (You are free to build your assumptions based on your own evaluation of Sales growth and margins). Thus the return expectations for the next 5 years will be a combination of earnings growth (which we expect to be around 14% to 23%) and the change in valuations.
In our next post, we will use a similar framework to evaluate valuations.

3 thoughts on “Equities – dismantling the returns !!”