

The lure of past returns..
Let us assume you had to invest in debt funds a week back, i.e 7th,February 2017. And you are shown the last 3 year returns of the major debt fund categories.

*Compounded annual returns as on 07-Feb-2017 , Source: Value Research
Note: I have considered some sample funds from the major fund houses for ease of explanation
Which fund category would you choose?
Looks pretty obvious right. ~12% compounded annual returns in the last three years for Income funds vs 8% in Liquid Funds.
Wow! Let me invest in Income fund category.
This is precisely how most of us end up taking our investment decisions.
But haven’t we heard the saying “There is no such thing as high returns without risk”
And then 8th February, 2017 happened..
On 8th, February, 2017 something strange happened.
Did I see it right?
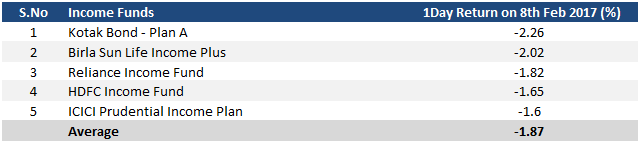
Negative returns in income category of debt funds. A fall of ~2% in a single day. Oops!!
What the f&%$??
But weren’t debt funds supposed to be similar to fixed deposits and have stable returns?
Now before we jump into conclusions, let us also check the other categories in debt funds..

The fall seems to be a lot lesser in Short term funds and Ultra short Term funds. Liquid funds seem to have no impact.
But..why??
Returns and Risk – two sides of the same coin..
Investing, unfortunately is a two sided coin.
Most of us only see one side of the coin – ‘returns’, which is obvious as it is concrete and easily available. All you need is value research or morningstar and you have all returns presented to you in a platter.
But the other side of the coin – ‘risk’, is a lot more subtle and hidden from plain sight. And this is where the problem lies as more often than not – it is ignored.
The problem is compounded by the fact that there is absolutely no way in which you can put a concrete number to measure risk. Think about it, what is the risk of you falling from your bike tomorrow. Now based on the traffic, speed etc you can come up with an approximate evaluation.But to come up with a precise number is impossible as it involves a lot of unknowns.
The same thing applies to evaluating risk in investing.
So the key is not to get lost in statistical numbers like standard deviation etc in the quest to quantify risk. Rather the idea is to intuitively understand the drivers of returns and get an approximate sense of the underlying risks. This is more an art rather than science.
The above event is a great opportunity to start appreciating the dynamics between returns and the underlying risks in debt fund investing.
Behind the scenes..
You can go through this earlier article of mine to understand the drivers of debt returns
https://eightytwentyinvestor.wordpress.com/2016/07/26/a-primer-for-investing-in-debt-mutual-funds/

As explained above,
Debt Fund Returns = Interest Income + Price impact due to interest rate changes
- Returns from interest income for a fund will approximately be = YTM – Expense ratio
- Returns from interest rate changes = (-1)*Modified Duration*Change in interest rate
Now using the above framework, while the first component (Net YTM) is pretty stable, the modified duration is the component which increases or decreases returns based on interest rate movement (inverse relationship – higher returns when interest rates fall and vice versa).
The higher the modified duration the greater is the degree of rise or fall when interest rates change.
So let us check the modified duration for our funds,

Are you able to join the dots? (Hint: compare the modified duration and return impact)
Modified duration is the villain..
The funds with higher modified duration have fallen more. This means yields (or interest rates) have gone up. Let us check if that is true.
On 8 th of Feb,2017, the RBI in its policy meet did not cut the interest rates. Further it changed its stance from “accomodative” to “neutral”. This spooked the markets as most of them were expecting rate cuts or at least an accomodative stance.
So yields for various debt instruments increased and as a result the mutual fund returns were down depending on the extent of modified duration.
The below is the yields of the 10Year Indian government bond. It went up from 6.43 to 6.74 i.e ~0.3% on 8th-Feb-2017.

Source: https://www.bloomberg.com/quote/GIND10YR:IND
The math behind the fund returns..
For the income category,let us assume the yields were approximately down 0.20% to 0.30% i.e an average of 025%. (rough estimate)
So for income funds where the average modified duration was 7.5 and Net YTM at 5.4% let us calculate the returns
The return for that day = (1) +(2)
1) Net YTM/365 = 5.4%/365 =0.015%
2) (-1)*Modified Duration*Change in interest rate = (-1)*7.5*0.25 = -1.875%
Return = 0.015% – 1.875% = -1.86%
which is approximately the fall in income funds on 8th February 2017.
So this is the math behind the fall, and now you can also understand why the fall in other categories were lower as their modified duration was also lower.
The “getting back to square one” arithmetic..
So assuming if the interest rates were to stay at the same levels, how long will it take to recoup my loss
Everyday return is around 0.015%. So to recoup the fall of 1.875% then the fund will need approximately 1.875%/0.015% = 126 days or approximately 4 months.
This is the risk that comes with modified duration. But if the interest rates were to go down you will make far higher returns.
Modified duration – Don’t forget the past hero avatar..
So now you might have a question:
The phenomenal 3 years of income funds which we saw in the beginning. Was that by any chance due to a fall in interest rates?
Bang on!
See the 10Y Indian Government bond yields for the last 3 years – from as high as 8.7% they had fallen to 6.4% !!

Summing it up..
Next time you pick your debt fund make sure you check the modified duration of the fund. If you decide to have a higher modified duration then you also need to take a call on the direction of interest rates.
So that simply means, whenever you invest in an income fund, you must also take a call on whether interest rates will go down or up.
If you don’t want the headache of trying to predict interest rate movement, stick to Ultra Short Term funds or Liquid funds.
Also for a more detailed approach to debt fund selection please refer the below post
8 factor framework for understanding any debt mutual fund
And if you found the post useful, do subscribe to the blog for regular updates.
P.S:
If the above post made went a little over your head, no worries.
You can try the introductory posts here and it should be fairly intuitive from then on. While it may take up some of your time, it will help you get a solid understanding of the basics and ensure that you don’t get taken for a ride by bad financial advice.
- A primer for investing in debt mutual funds (Link)
- 8 factor framework for analyzing any debt mutual fund (Link)
- Investing Chitra Katha – Understanding the impact of modified duration on debt fund returns (Link)
- The ultimate guide to liquid funds (Link )
- Here’s a quick way to select Ultra Short Term Funds (Link )
- Making sense of Short Term Debt Mutual Funds (Link)
- Credit funds – Don’t count your returns before they hatch (Link)
- Here’s why I don’t invest in credit funds (Link)
- Figuring out a simple do-it-yourself framework for short term investing (Link)

What a explanation!!!superb
Can you pls write abt
1. Equity MF selection
2. MF portfolio review and rebalancing
LikeLike
Thanks a ton Sunny for the inputs. I will write about equity mf selection in the coming weeks.
LikeLike
Hi Arun,
Nice article. I would like to know how to calculate modified duration with example. Can you help me?
LikeLike
Hi Anandan. Thanks a ton for your kind words. The modified duration is calculated by the fund houses and provided in the fund fact sheet or alternatively you can get them from valueresearch
LikeLike
Hello Arun,
Thanks for this article. Need couple of clarifications –
(1) Under the section “The math behind the fund returns..” , how did you arrive at 5.4%. If could show the calc ?
(2) You have mentioned “yields were approximately down 0.20% to 0.30% i.e an average of 025%. (rough estimate)”, so shouldn’t the Bond’s NAV increase due to the inverse relationship instead of going down as stated above ?
Regards,
Satish S.
LikeLike