

Investing in Debt Mutual Funds & Fixed Deposits = You are basically a money lender in disguise!!
Debt mutual funds at a very basic level are similar to Fixed Deposits. In both cases every time we invest our money, we are actually lending out our money indirectly to a borrower (the government/banks/companies/other people like us) who need money. The borrower promises to payback the borrowed money after a certain period of time and also pays interest regularly on the borrowed money.
This lending activity if to be done by us would involve a lot of effort and time consuming activities such as finding the right borrower, collecting the interest payments, ensuring he doesn’t run off with the money etc. In other words, if we were to do this on our own, we would be called a moneylender and is a pretty tough job!!
To help us out in our money lending activities, banks and mutual funds stepped in and became the intermediaries thereby connecting us (the lenders) and them (the borrowers). These intermediaries take some charges for their services and pass on the interest paid by the borrowers back to us.
When Banks are the intermediaries, our lending activity is called investing in Fixed Deposits. When Mutual Funds are the intermediaries, our lending activity is called investing in Fixed Income Mutual Funds. As simple as that.
The key is to remember is that, though we call it investing, we are also indirectly lending!!
Now, while at a broader level Fixed Deposits and Debt mutual funds seem to be similar, there are also some subtle differences which we must be aware of before making a choice between the both.
Let’s explore these differences..
1. Safety of capital – evaluating credit risk
As someone who invests in an F.D, though you are indirectly lending money, you don’t generally need to be bothered about the borrower as the risk is born by the bank and your invested original amount and interest income is almost guaranteed. While theoretically a bank can still become bankrupt, the probability is very low in the Indian context. That being said if you invest large amounts in Fixed deposits, its prudent to choose a reputed, well capitalized bank with strong balance sheet and low NPAs. Worst case, if a bank defaults or goes bankrupt then each depositor in a bank is insured up to a maximum of Rs 1 lakh for both principal and interest amount held by him.
But in the case of a debt fund, there is a slight difference. In debt funds, if the underlying borrower defaults on the interest or principal then the loss is directly passed on to the investor. Or in other words, in an FD our risk is on the bank while in a debt fund our risk is directly dependent on the underlying borrowers. This risk is called “credit risk”.
Most of the debt funds comfortably reduce/manage this credit risk by diversifying across several borrowers and sectors, conducting thorough analysis on the ability of the borrower to repay, sticking to high quality borrowers, evaluating credit rating of the borrower (rating provided by credit rating agencies and internal teams within fund houses), ensuring security and collateral etc.
However that being said, as prudent investors, we must also have a hang of whether the debt fund is undertaking any credit risk by choice.
But how in the world will we be able to evaluate each and every borrower that the mutual fund has lent our money to. To our rescue come the credit rating agencies (CRISIL, ICRA, CARE and Fitch). These are neutral agencies which evaluate and rate every debt security based on their ability to repay the interest and principal. The rating scale range from ‘highest safety’ denoted by the symbol AAA to potential ‘default’ grade which is represented by a D symbol

Source: CRISIL
The below table shows the percentage of defaults and downgrades (moving to a lower credit rating scale) under various ratings from 1988 to 2015
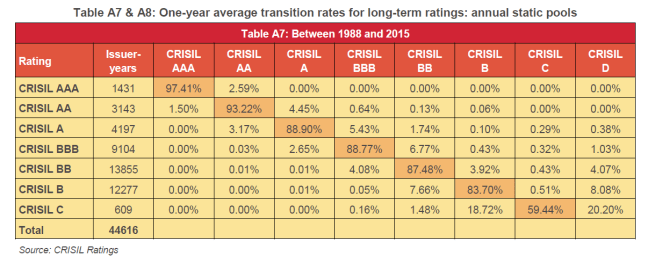
Source: https://www.crisil.com/pdf/ratings/CRISIL-Default-Study-2015.pdf
Government securities (Gilt/Sovereign) are the safest as they have 0% probability of default in practical terms as you are lending to the government. Further as seen above, AAA rated securities historically have never had a default. Further only 2.6% of AAA papers have got downgraded to AA rating in the last 18 years. Thus we can conclude that AAA rated securities are very safe in terms of safety of capital and payment of interest.
So the higher the % of AAA and government securities in the portfolio of debt mutual fund lower is the credit risk i.e probability of default or downgrade in the fund. Even AA papers are fine to a certain extent.
You can check the fund’s underlying credit quality from morningstar website. See below a snapshot of the fund IDFC SSIF Medium Term Plan. As seen , the fund had almost 98% in AAA securities which means the fund has consciously avoided credit risk in the fund.

Now, you must be wondering if that’s the case then why don’t all the funds invest only in AAA securities and Government securities so that there is no credit risk.Simple, higher rated debt securities pay lower interest rates compared to lower rated debt securities (as a borrower if my rating is not that great I will have to offer a higher interest rate to attract lenders). There are a set of funds who use this strategy of lending to lower rated borrowers (referred to as credit strategy or accrual strategy) to take advantage of the higher interest rates and hence provide higher returns in the fund. Their fundamental belief is that by deploying their own analysis to these lower rated papers they would be able to identify the “cleanest amongst the dirty shirt” and hence provide investors with a higher return.
Since FDs do not transfer the borrower risk to us, we don’t get an option to improve upon the returns irrespective of who the bank lends to as the returns are already fixed. So be it Vijay Mallya or Tata, whoever the bank is lending our money to, we get the same interest rate in FD.
Debt funds since they pass on the interest paid by the borrowers directly to us (post the intermediation charges), provides us with an option of
- Sticking to high credit quality and have minimal credit risk just like in FD
- Investing in funds with lower credit quality (i.e higher credit risk) but also with potential of higher returns if there is no downgrade or default
Now let’s not immediately get into the debate of whether to go for “accrual funds” or not at this juncture (don’t worry we will discuss that in the coming posts). The idea of this post is to appreciate the options available in a debt fund vis-a-vis a fixed deposit.
2. Source of returns
In case of a Fixed deposit, this is pretty straight forward as our returns will be equal to the FD interest rates which are explicitly communicated at the time of investing and are guaranteed.
You can check the lastest FD rates here: http://www.bankfdrates.in/compare-fd-rates/

But how do we find out our expected returns from a debt fund ???
Debt Funds unlike a simple FD return have 2 sources of returns
Debt Fund Returns
=
Interest from underlying debt securities
+
Price changes in the market value of debt securities
(based on interest rate changes)
1) Interest from underlying debt securities (pretty similar to FDs)
This is the easy stuff. Debt funds simply collect interest from underlying borrowers (i.e the debt securities) and pass it on to us (investors) after taking their intermediation charges (called expense ratio).
Now how do we find out the interest rate paid by the underlying borrowers in the debt fund. Simple. There is something called Yield to Maturity or YTM for every fund which you can find it in the fund fact sheet or sites like Morningstar, Value research etc. Due to the fear of boring you to death, I am not going into a jargon laded explanation of YTM.
YTM or Yield to maturity is simply the aggregate interest rate (return) from the underlying debt securities in the fund . The fund will charge an intermediation charge (read as expense ratio) which will be deducted from YTM and the remaining will be added to the fund return.
So the returns to expect from a fund will approximately be = YTM – Expense ratio
{ Remember we spoke about some funds using a credit strategy. A credit strategy helps the fund to get a higher YTM compared to other funds which don’t take credit risk and thus higher returns if there is no default or downgrade }
Since debt fund NAV (i.e the market price of the fund) is available everyday , the interest income (YTM-Expense ratio) is divided into 365 days and added to the fund NAV everyday.
Everyday Interest Income Received = (Yield to maturity – expense ratio ) / 365
Let us understand this with an example:
Let us take the example of IDFC SSIF Medium Term Plan

In the above example, 1) YTM is 7.86% and 2)expense ratio is 1.22%
Its reasonable to expect returns around 6.64% due to interest income from the fund (i.e 7.86-1.22%) and if interest rates stay around the same level.
Therefore the debt fund NAV will move up by (YTM-Expense ratio)/365 i.e (7.86%-1.22%)/365 = 0.018% everyday.
In other words for every Rs 100 invested in IDFC SSIF Medium Term Fund, you will get 1.8 paise added everyday.
But interest rates (YTM from a fund’s perspective) may change over a period, as it is market driven as it is influenced by RBI Monetary policy, inflation expectations, demand and supply, economic growth, macro factors etc. Depending on whether the interest rate is going down or up, the corresponding returns from interest income also fall or increase.
Now enters, the second source of return in debt funds which is not available in Fixed Deposits..
2) Price changes in the market value of debt securities (due to interest rate changes)
Debt mutual funds hold a portfolio of debt securities (assume it to be like a loan document which entitles the holder to receive the payment of principal and interest and can be transferred amongst various lenders). Debt funds have to value the debt securities every day based on the current market value. The prices of debt securities are inversely proportional to the interest rates i.e the prices increase if interest rates go down and prices decrease if interest rates go up.
Logic behind the inverse relationship : Assume a company issues a debt instrument in the market that fetches its holder an interest rate of 8%. A few months later if the interest rates in the economy go down, there will be newer debt instruments that would offer a lower interest rate of say 7%. Since these new instruments have a lower return than the 8% interest instrument, the value (market price) of the older paper and correspondingly the net asset value (NAV) of the debt fund that has invested in these papers also goes up.
This change in prices of underlying debt securities is the second component of returns, which either adds positively or negatively to the first component “interest income” returns, depending on whether interest rates are going down or up.
But by what % does the fund NAV move for interest rate change ??
This sensitivity of a fund’s underlying security prices impact to change in interest rate is measured by Modified Duration. Modified Duration is indicated in years and tells us the % change in price returns of the underlying debt securities for every 1% change in interest rates.
Change in debt fund “price” returns = -1*Modified Duration * % change in interest rate
Since price changes of a debt fund is inversely proportional to interest rate changes I have used a negative sign.
Let’s go back to our example of IDFC SSIF Medium Term Plan.
The modified duration is 2.51 yrs. This implies that if the fund YTM moves up by 1% then the aggregate price of underlying debt securities in the debt fund go down by approx 2.5%. Similarly if the interest rate moves down by 1% the price of the debt fund will move up by approx. 2.5%. Thus, modified duration will give estimates of sensitivity of the fund towards every 1% movement in interest rates.
This price risk due to interest rate fluctuations is called “interest rate risk”.
Again just like credit risk, funds have the choice to take up interest rate risk or not. Funds such as Liquid funds and Ultra Short Term funds keep the modified duration very low (typically less than 1 year) and hence don’t take or minimize interest rate risk. Funds like income funds have high modified duration which can be used by investors to take advantage of declining interest rate scenario. There are also “dynamic funds” which keep adjusting modified duration based on the fund manager’s view on interest rates ( low modified duration if they expect interest rates to go up and vice versa). This attempt to improve returns by managing duration over an interest rate cycle is called duration strategy.
Average maturity is another metric which tells you the weighted average maturity of the underlying debt securities in the fund which in turn also indicates interest rate sensitivity. Higher the average maturity higher will be the interest rate sensitivity. But unlike a modified duration it doesn’t give the you the precise sensitivity.
Thus summing it up :
Debt funds have two sources of returns
Debt Fund Returns = Interest Income + Price impact due to interest rate changes
- Returns from interest income for a fund will approximately be = YTM – Expense ratio
- Returns from interest rate changes = (-1)*Modified Duration*Change in interest rate
Unlike an FD where returns are fixed, Debt funds can additionally use two strategies to improve returns
- Credit strategy – lending to lower quality borrowers for higher YTM
Risk – possibility of default of downgrade- Duration Strategy – managing modified duration at the fund level based on interest rate view
Risk – Price risk if interest rate call goes wrong
Phew..that’s a long post.
In our next post, we shall see how to choose appropriate funds for our requirements. Till then happy investing folks 🙂

Excellent article- I have read many articles already on FD vs.MF debt funds. I bet your article is the best so far.
LikeLiked by 1 person
Thank you so much Mr Ravindran. Do keep visiting 🙂
LikeLike
Well articulated Arun.
LikeLike
Thanks da
LikeLike
Superb sir
LikeLike
Thank you Mr Saleem
LikeLike
Thank you for the excellent explanation.
LikeLiked by 1 person
Glad you liked it Mr Prasad
LikeLike
A Very good article Arun. Keep up the good work
LikeLiked by 1 person
Thanks a ton Shoban 🙂
LikeLike
Superb article. You explained very clearly the basics of debt fund. I’m going to continue reading the part 2 and part 3. Stumbled on to your website due to the real estate article from one investor forum. i clicked it out of curiosity, breaking my cardinal rule of ignoring the click-baity titles. I’m glad I did it. You keep doing the good work, Mr.Arun.
LikeLike
Thanks a ton, Mr Rajesh
LikeLike
There are lots of views on effect of inflation while planning for retirement funds- and why FD is not the best avenue ( since post tax return from FD will be grossly inadequate the inflated expenses.) This is because it is assumed that expenses will be keep growing at compounded rates while the interest on FD will be on the fixed corpus . Hence Equity MF with a post tax return of 12 to 15 % is recommended by all experts. Please clarify whether in the case of MF -is it right to assume that the corpus will remain fixed ( for calculation purposes ). Further , what happens when FD rates go south with falling inflation rates ( as it happened in Western countries and Japan). Please see below the calculations and comment.
Year of Retirement 2016
Annual Corpus 5000000
Living Expenses Inflation FD Rate Income from FD Surplus deficit Cum Deficit
Age Years Year Rs Rs
60 0 2016 240000 7.00% 350000 110000 110000
61 1 2017 254400 6.00% 7.50% 375000 120600 230600
62 2 2018 267120 5.00% 6.50% 325000 57880 288480
63 3 2019 284483 6.50% 7.00% 350000 65517 353997
64 4 2020 304397 7.00% 7.00% 350000 45603 399601
65 5 2021 330270 8.50% 7.50% 375000 44730 444330
66 6 2022 359995 9.00% 8.00% 400000 40005 484336
67 7 2023 388794 8.00% 8.00% 400000 11206 495541
68 8 2024 421842 8.50% 8.00% 400000 21842 473700
69 9 2025 459807 9.00% 8.50% 425000 34807 438892
70 10 2026 496592 8.00% 8.00% 400000 96592 342300
71 11 2027 531354 7.00% 7.00% 350000 181354 160947
72 12 2028 563235 6.00% 6.50% 325000 238235 -77288
73 13 2029 591396 5.00% 6.00% 300000 291396 -368684
74 14 2030 615052 4.00% 4.50% 225000 390052 -758737
75 15 2031 633504 3.00% 3.50% 175000 458504 -1217241
76 16 2032 652509 3.00% 3.50% 175000 477509 -1694750
77 17 2033 678609 4.00% 4.00% 200000 478609 -2173359
78 18 2034 705754 4.00% 4.50% 225000 480754 -2654113
79 19 2035 737513 4.50% 5.00% 250000 487513 -3141625
80 20 2036 778076 5.50% 6.00% 300000 478076 -3619701
81 21 2037 824760 6.00% 6.50% 325000 499760 -4119462
82 22 2038 878370 6.50% 7.00% 350000 528370 -4647831
83 23 2039 939856 7.00% 7.50% 375000 564856 -5212687
84 24 2040 1010345 7.50% 8.00% 400000 610345 -5823032
85 25 2041 1101276 9.00% 9.50% 475000 626276 -6449308
LikeLike
Hi Ravindran..Actually since the comment section doesn’t allow pasting of tables, I am not able to interpret the table you sent me. You can mail me at rarun86@gmail.com with the excel if it is ok with you. Now historically FD rates post taxation has not kept up with inflation which implies that you will need a very large corpus to retire if you are only dependent on FDs. Generally retirement corpus can be split into buckets 1y-Liquid funds, 2-3Y – Short term debt fund, 4-5Y – Dynamic Equity Allocation funds and greater than 5 years in equity funds. So in this way you protect your near term requirements and allow long term requirements to benefit from investing in equities. All returns will adjust to inflation. So in the future if inflation were to hypothetically drop down to say 2% then FD rates and Debt fund rates also will drop close to that. Even equity returns will drop to say around 8-10%. Dont worry about absolute returns and only look at what returns you get with respect to inflation. You can refer to my old post here https://eightytwentyinvestor.wordpress.com/2015/11/29/mind-your-inflation/
LikeLike
Intresting detailed analysis. The meaning of terms like modified duration been explained very beautifully. Keep it up
LikeLiked by 1 person
Thanks Amarjeet
LikeLike
Its a brilliant article. It was very easy to understand. Thanks 🙂
Happy reading and understanding
LikeLike
Thanks a ton Sunita
LikeLike
Fund managers change their portfolios dynamically. As a result, Modified duration one week after the date of interest hike may be lower than what it was a week earlier, if the fund manager feels that interest rates are going to rise, going forward. Therefore time taken to recover from an interest rate hike in a debt fund can be lower than what is predicted on the day of the hike.
LikeLike
True. But the change in modified duration will get reported in the next month’s factsheet. So while we won’t be able to do a precise calculation we can approximately get an idea by monitoring the modified duration numbers which get reported every month
LikeLike
Can you explain the difference between Yield to maturity and the total returns on a debt fund ? I don’t exactly understand that.
LikeLike
When you invest in a debt fund you are effectively lending out your money to different companies. Now all these companies pay you some interest for borrowing your money. Think of Yield to Maturity as the aggregate interest rate that the underlying companies in the fund are paying you for borrowing from you. This can be thought of as something similar to the interest rate that your FD pays. The YTM-Expense Ratio is the approximate return that you can expect from your debt mutual fund. The second component which affects your return is the change in interest rates which I have explained in the article. Hope this helps.
LikeLike
Hi Arun,
I chanced upon your article and found it to be a very interesting read. Your way of explaining is great and helps in clarity of thinking.
I have a follow-up query on the this piece – specifically about the modified duration related impact on debt fund price. Wanted to understand which interest rate is the daily fund NAV calculation dependent on? Is it a daily published or traded rate that we can access? Also, is this rate/ index different for different type of debt fund or different types of bonds in the debt fund?
LikeLike
Thanks a ton Sum06. The interest rate to be tracked will be dependent on the maturity of securities that the fund is holding. As an approximate measure you can check the average maturity and track the a similar duration government paper or corporate AAA paper. For eg for a short term fund with 2 year average maturity you can track interest rate changes in 2Y AAA interest rates. If you don’t have access to this data, then stick to 10Y Government Security paper for a rough estimate (https://www.bloomberg.com/quote/GIND10YR:IND)
LikeLike
Thanks! Arun. Is this what the fund managers also use for daily update of the NAV of the fund?
LikeLike
The fund managers track the actual underlying bond’s price movements. But since we don’t have access to these, we need workarounds as discussed above
LikeLike
Hello Arun,
Thankyou for this insightful article. A quick clarification re. Logic behind the inverse relationship : Assume a company issues a debt instrument in the market that fetches its holder an interest rate of 8%. A few months later if the interest rates in the economy go down, there will be newer debt instruments that would offer a lower interest rate of say 7%. Since these new instruments have a lower return than the 8% interest instrument, the value (market price) of the older paper and correspondingly the net asset value (NAV) of the debt fund that has invested in these papers also goes up.
So, essentially, the inverse relationship between YTM and Bond price is driven by the fundamental principle of Demand-Price economics i.e., The older instruments with 8% YTM become more attractive (due to their higher YTM) than the newer instruments with 7% YTM => so, the demand for older instruments rises => therefore, the prices go up.
Am i correct?
Regards,
Satish S.
LikeLike
Bang on. You are correct 🙂
LikeLike
Hello Arun,
Reading the concept of Modified Duration, leads me to believe that MD in Fixed Income is something similar to BETA in Equity which shows the volatility of the Eq returns to the Sensex/Nifty movements. So, if a Equity mutual fund has a beta of 1.2 and the market is expected to move up by ten per cent, the fund should move by 12 per cent.
Right ?
Regards,
Satish S.
LikeLike
True Satish. It is pretty similar to that except for the fact that in modified duration the relationship is inverse
LikeLike
Oh, yes. I missed to observe that part. Thanks Arun.
LikeLike
Hi Arun, very helpful article with details shared in simple to understand language. No doubt this is redditors default go-to article regarding debt funds.
LikeLike
Thanks a ton Gagan 🙂
LikeLike
Thank you so much for this post. I finally understood the basics of debt funds. You made it look simple.
LikeLike
Thanks and glad you found it useful 🙂
LikeLike
Thanks.
Wow very informative and I learned how to find debt returns. Everytime I use past returns and look for AAA in debt funds.
Now I will look on YTM, modified duration , expense ratio 🙂 thanks Arun
LikeLike