

Debt Mutual Funds were actually supposed to be a simple investment option which could be used as a more liquid (can be sold anytime without penalties) and tax efficient alternative (if held for >3 years) for Fixed Deposits.
Unfortunately, debt funds have been unnecessarily complicated thanks to our lure for those little “extra” returns.
Here is an attempt to simplify things for you and hopefully after reading this you should be able to evaluate debt funds in a much better manner.
Back to the basics..
Investing in Debt funds = You are lending your money

When you buy any debt mutual fund, the first thing to remember is that you are actually indirectly LENDING your money to companies or the government.
Why will you lend?
Simple. The companies and government who borrow from you will pay you interest for borrowing and repay back the original amount borrowed after the maturity period.
Since you don’t have the expertise or bandwidth to do the lending activity and collect the interest payments, debt mutual funds do this on behalf of you for a small cost. This cost is called expense ratio.
Now when you lend what is the first question that you normally ask?
What is the rate of interest that you will get?
This in debt fund jargon is called Yield to Maturity or YTM.
Nothing to freak out – think of this as the aggregate of the interest rate paid by the underlying borrowers (government/companies).
Where do you find this?
For the purpose of explaining, let me use HDFC Short Term Fund as an example. (please don’t take this as a recommendation)
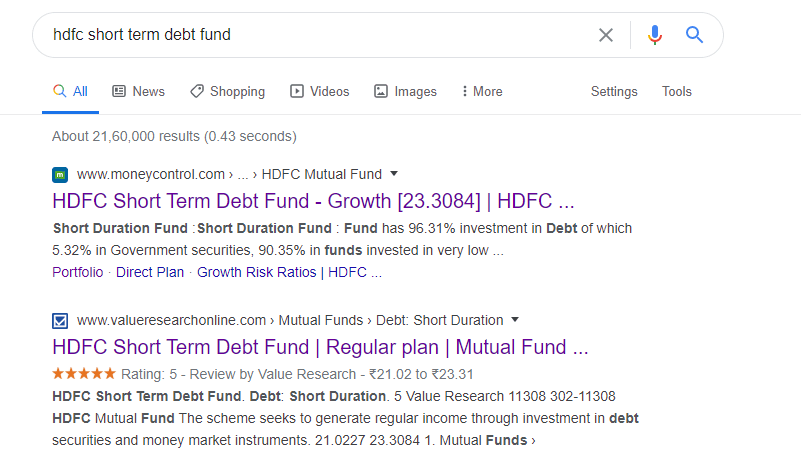
Go to Google and type: HDFC Short Term Fund
You will get something like this. Click the value research link.
- Choose the plan – Direct or Regular (by default it is in regular)

2.Click on the Portfolio tab
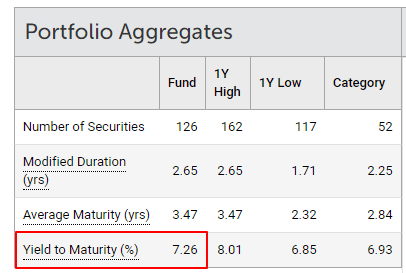
As seen above, the YTM is 7.26%. So this means roughly my interest rate to expect from this fund is around 7.26% per year. Think of this as a rough proxy for FD interest rates.
Cool. So this should roughly be my next year returns too right?
Hang on, the debt fund manager can’t pass the whole thing to us as they need to get paid for this intermediation activity. These charges are called expense ratio. So our return expectations need to be adjusted for the expense ratio.
What is the expense ratio?
You can check this from the same valueresearch source
- Expense Ratio for Direct Plan: 0.24% as on 31-May-2020
- Expense Ratio for Regular Plan: 0.39% as on 31-May-2020
What is our expected interest rate post the expense ratio?
This is called Net YTM = YTM – Expense Ratio
Net YTM for Direct Plan: 7.26% – 0.24% = 7.02%
Net YTM for Regular Plan: 7.26% – 0.39% = 6.87%
Cool. So this is approximately what we should expect from the fund over the next one year right?
All else being equal this assumption is fine.
BUT what the heck is this ALL ELSE BEING EQUAL? Now you are confusing me!
This is where the interesting part begins. Grab your coffee and hang on!
There are chances that we might end up with much higher returns or sometimes much lower returns than the NET YTM.
Obviously we don’t mind the much higher returns part. But let us understand more on how it can become much lower?
3 Risks in Debt Mutual Funds
There are three risks which can lead to lower returns than your Net YTM
- Credit Risk
- Liquidity Risk
- Interest Rate Risk
1. CREDIT RISK
As long as the underlying borrowers pay the interest regularly and finally settle us the principal amount we are fine. But what if something goes wrong with the company and they don’t pay us back?
This is called Credit Risk. If the underlying company defaults on the interest or principal payment, then all the particular debt fund holders will take a corresponding NAV hit proportionate to the exposure to that particular borrowing.
Oops! So how in the world will I evaluate each and every security in my debt fund and find out if they will default or not?
Ideally this is why you need to pick good funds where the fund manager has a proven track record of zero defaults. This is exactly the role of the fund manager. But that being said, there is a quick check that we can also do from our side.
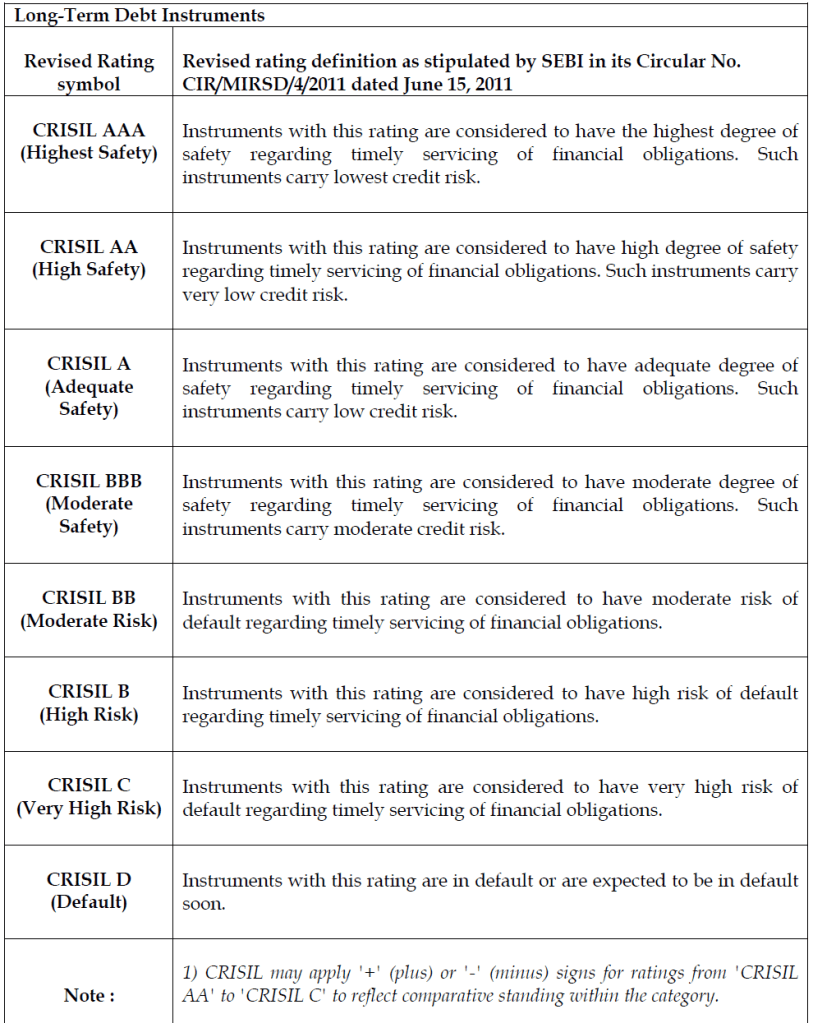
To our help comes the credit rating agencies.
These are neutral agencies which rate the quality of the underlying borrowers. Their rating goes from AAA being the highest quality, AA slightly lower and so on till D as shown below.
So let us check how the underlying borrowers are rated for HDFC Short Term Fund. I use a website called FundzBazar for checking this. (This is the best website out there for analysing debt funds.)

Sovereign means you have lent to government, so absolutely no worries and this is the highest quality possible. Adding up AAA & Equivalent, Cash & Equivalent and Sovereign we get ~83%.
In other words, it means 84% of our money has been lent to the highest quality and safest borrowers.
What about the remaining 16% in non AAA category?
While this would have got you concerned, it is not a great idea to immediately paint this entire bucket as high risk. We need to check who these borrowers are. Sometimes even very high quality names may get a lower rating for various reasons.
Let us first check A+/A/A- rated papers
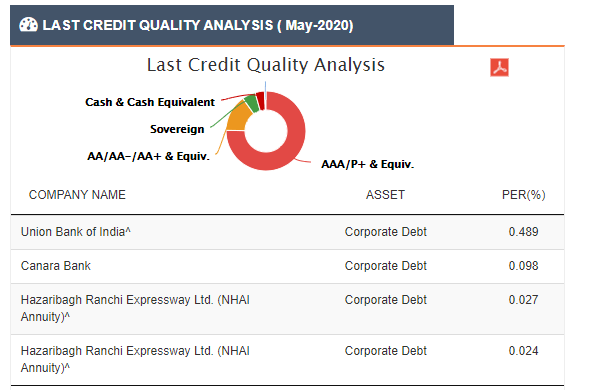
Union Bank of India and Canara Bank are PSU banks and hence we don’t need to worry. And either way they are just 0.6% of the total fund exposure.
Hazaribagh Ranchi Express way was a special purpose vehicle (“SPV”) which is a subsidiary of IL&FS Transportation Network Limited (“ITNL”, subsidiary of IL&FS). The exposure to NCDs issued by HREL is backed by annuities from National Highways Authority of India (NHAI, rated AAA).
This is an inconsequential 0.05% and hence doesn’t matter.
Just in case you want to dwell more, you can refer to the AMC’s communication on Hazaribagh Ranchi Expressway here
So no major concerns on A+/A/A- borrowers.
Let us now check AA+/AA/AA- rated papers

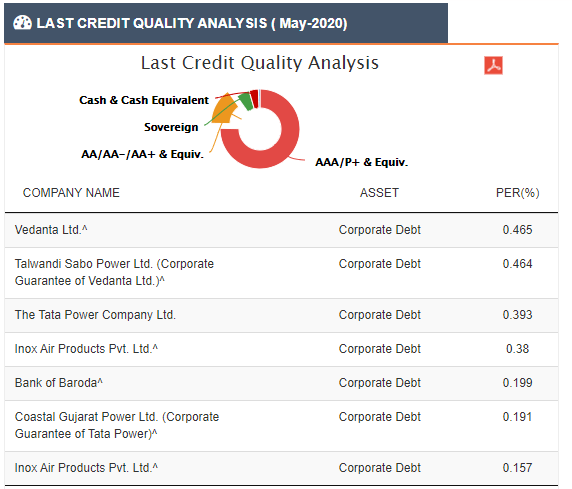

As seen above this portion is predominantly into Banks (SBI, Bank of Baroda, HDFC Bank), Large Reputed Groups (Vedanata Group, Tata Group, Hindalco (Aditya Birla Group), Shriram Group. So even the non-AAA expsoure looks fine and there is nothing to worry.
There is around 0.6% exposure to Inox Air Products which I don’t have much idea about but it’s a very small holding.
So taking a similar approach you can check for the credit quality of your fund and the underlying exposures. If non AAA exposure to a single risky paper very high (say above 5%) then this is a red flag.
There have been cases where even AAA rated borrowers have defaulted. So should we trust the rating agencies?
While this is a very low probability event, this is exactly why we need to pick a good debt fund which has strong internal credit rating process and has a strong track record.
Ok, but how do I check the track record of the fund manager in managing credit risk?
A quick visual way, would be to check the NAV movement for the last 5 years.
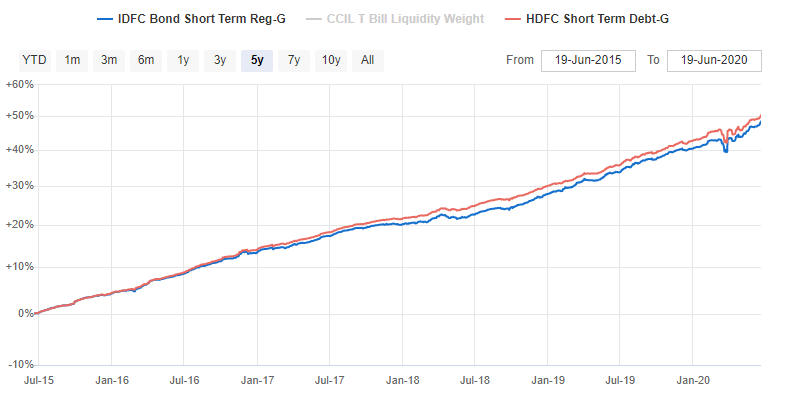
I have checked the movement along with IDFC Short Term which is fund which runs 100% AAA portfolios to see if there is any large deviations. The NAV movement is very smooth and hence we can conclude that there is no major credit event which has played out in the fund.
Just for perspective, if there is a credit event it will look like this
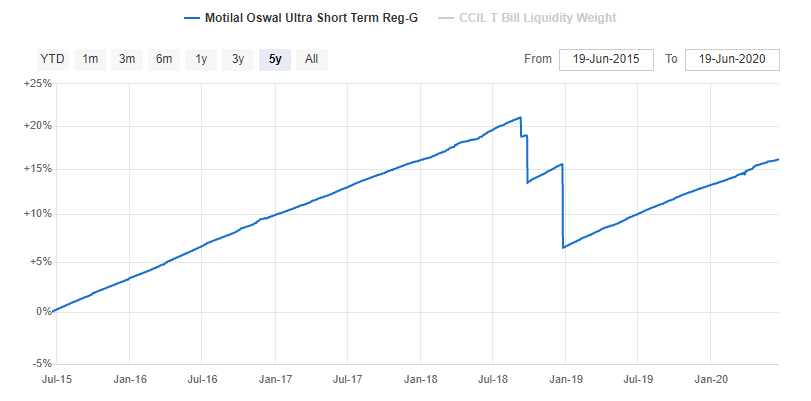
This fall was due to IL&FS exposure which had defaulted.
So looking at the NAV movement can give a good idea on the past credit events if any.
Looking at other funds in the same AMC can also be an additional check to get a sense of the AMC’s credit risk management team.
Great! Anything else you need to check?
Generally it is also a good idea to know what has usually been the non AAA exposure range in the past.
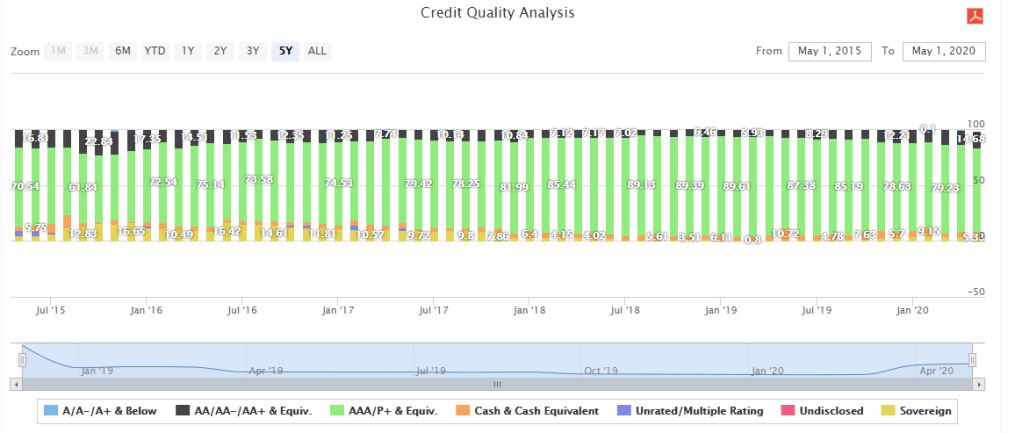
As seen above, HDFC Short Term Debt Fund has historically maintained the non-AAA exposure between 5-20%. So if let’s say tomorrow we find the non AAA exposure shooting upto 25%-30%, this should be a red flag to us.
So this is how you can evaluate the credit risk in your debt funds. Ideally you should do this exercise every month.
But why in the world do fund managers take non AAA exposure? Can’t they have it entirely in AAA & Equivalent securities?
There are a lot of funds which have 100% AAA equivalent portfolios and you can always go for it. The reason why fund managers have exposure to non AAA quality papers, is for getting slightly higher returns. Being non-AAA these companies will have to pay more interest to borrow from us. As long as they don’t default, we can get higher interest rates and thus higher returns. Upto 20% non-AAA is still fine in my view, provided the fund manager has a good track record of managing credit.
2. LIQUIDITY RISK
Most debt mutual funds are open ended. This means you can sell your debt funds at any point in time and the fund house has to give your money back in 1-2 days based on the type of fund. Theoretically, all investors in a debt fund can sell out of the fund at the same day and the fund will have to sell its entire underlying holding and give back the money in 1-2 days.
Sometimes the fund may not be able to sell the underlying holdings due to a lack of a buyer. In this case the fund house, will not be able to give back the money and this is called liquidity risk.
As a rough thumb rule you can assume that Sovereign and AAA rated securities will have high liquidity i.e can be sold off easily and quickly.
Non AAA securities are usually very illiquid in the Indian context and hence can’t be sold immediately.
So debt funds with >80% in AAA and equivalent securities have very high liquidity and you don’t need to worry.
For other debt funds with higher exposure to non AAA securities, you need to keep a close watch on redemption trend.
Whenever there is a large redemption trend, then the fund is forced to sell the more liquid higher quality AAA papers. This leads to unintended increase in the exposure of illiquid non AAA papers.
This also leads to much higher concentration risk (and higher NAV fall) for the lower quality papers if in case they default. Here is a live example of how this plays out – link
Sometimes the funds are forced to borrow from their bank lines to meet redemption pressure. This gets captured as a negative allocation under the cash & current asset in the fund’s portfolio.
Red Flag: Significant Redemptions + Increasing % of illiquid non AAA exposure + Negative Cash Balance
In the worst case, the fund may have to shut down and stop investors from redeeming. This is exactly what happened to Franklin Templeton’s 6 credit risk oriented funds. In this case it can be a long painful wait to get your money back. This is exactly why you need to keep a tab on liquidity risks.
You can read as to how by using this simple framework you could have identified the brewing liquidity crisis much before it happened – link. This was written 2 months before the crisis hit.
In our example of HDFC Short Term Fund, the liquid AAA exposure is around 84%. So liquidity shouldn’t be a problem.
The AUM trend is also very stable and no redemption pressure.
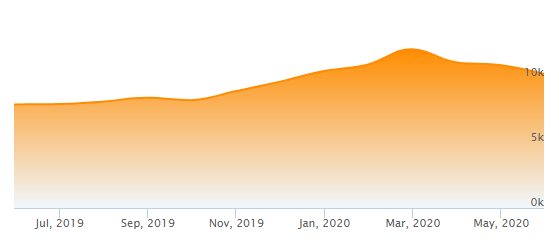
Cash, Cash Equivalents and Net Current Assets is at 6.4%.
So the fund does not face liquidity issues at the current juncture.
What are the other things to monitor?
If in case of a fund where non AAA exposure is >40%, you also need to monitor these two parameters
- Check for non AAA exposure above 3%
- Check for non AAA exposure with a maturity date greater than the average maturity of the scheme
Prefer Larger AMCS with a Banking parent
I have realized that large AMC’s especially ones with a banking parent have more optionalities when it comes to selling their securities if in case of redemption pressure. In case of a smaller AMC, make sure their credit risk management history is top notch.
- Banking parent can absorb the securities
- Intra-Scheme Transfer to other large Hybrid funds
- Insurance Arm can chip in
- Cash rich AMC can buy the security temporarily (Check the case of HDFC AMC buying Rs 500 crs of Essel Group papers from its schemes Link)
- Strong Distribution Arm can also provide significant control over redemptions
- Most of them also communicate really well during crisis thereby to a large extent hand holding distribution partners and clients
So personally I have a bias for larger AMCs as anyway the return profile is very similar for high quality funds.
3. INTEREST RATE RISK
If interest rates move up, then there is a NAV fall and if interest rates move down then there is an NAV gain. The extent of fall or gain in NAV will depend on the modified duration of the fund.
NAV Impact = -1 * Modified Duration * Change in interest rates
For eg: If Modified duration is 2 and the interest rates move up by 0.5%. Then the overall negative NAV impact due to increase in interest rate is 2*0.5%=1%
So modified duration multiplies the impact of interest rate changes. Higher the modified duration higher is the NAV impact and vice versa.
If you don’t want this risk, then stick to funds with low modified duration – less than 1 year. Usually up to 3 years in modified duration can be considered if you have a 3+ year investment time frame.
HDFC Short Term belongs to the short term category and SEBI mandates that the fund should maintain its Modified Duration (actually it is Macaulay’s Duration as per SEBI – but for practical purpose both are more or less very similar) between 1-3 years.
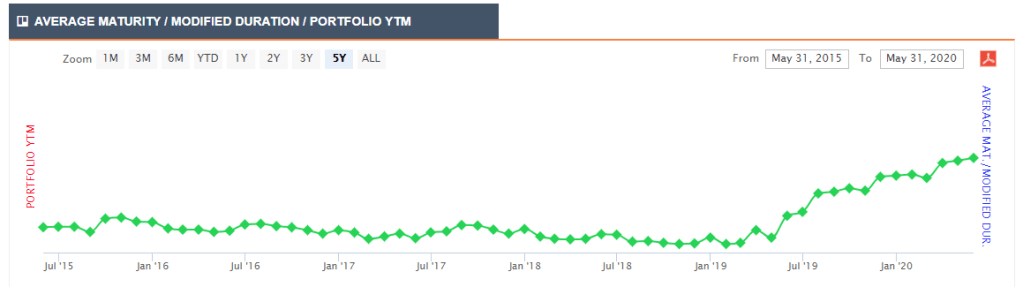
Currently the fund has a modified duration of 2.65. This implies the fund has a moderate interest rate risk.
If interest rates go up by
- 0.25% = Negative NAV impact of 2.65*0.25% = -0.66%
- 0.5% = Negative NAV impact of 2.65*0.5% = -1.32%
- 0.75% = Negative NAV impact of 2.65*0.75% = -1.98%
- 1% = Negative NAV impact of 2.65*1% = -2.65%
This will be +/- the Net YTM which will get accumulated an a daily basis. Everyday the fund will receive stable returns of Net YTM/365.
How do we translate this into return expectation?
Approximate 1 month return expectation:
- Net YTM returns: Net YTM/12 = 6.87/12 = 0.57%
This will be the return expectation if the interest rates are stable.
However, if interest rates go up by
- 0.25% then 1 month return will be = 0.57% – 0.66% = -0.09% but from next month the Net YTM returns will be higher at 0.59%
- 0.5% then 1 month return will be= 0.57% – 1.32% = -0.75% but from next month the Net YTM returns will be higher at 0.61%
- 0.75% then 1 month return will be =0.57% – 1.98% = -1.41% but from next month the Net YTM returns will be higher at 0.64%
- 1% then 1 month return will be = 0.57% -2.65% = -2.08% but from next month the Net YTM returns will be higher at 0.66%
This is why usually it is recommended to match your time frame with the average maturity of the fund so that the interest rate volatility can be evened out and you can mostly end up with a return close to Net YTM. The rough logic is that if interest rates move up, the one time NAV decline due to this can be made up with the incremental returns from Net YTM gradually over time. (I am oversimplifying of course and there are some nuances which I will explain in a future post)
Summing it up:
As explained above, you can evaluate the three risks – 1) Credit Risk 2) Liquidity Risk 3)Interest Rate risk for your debt mutual funds.
Post this you can check on the consistency in returns, volatility, fund manager track record, communication and AMC pedigree to choose your funds.
If you want to explore more, you can also check my earlier post on debt evaluation framework here
Do let me know if you found this useful.
If you have any thoughts or would want to connect you can mail me at rarun86@gmail.com.
If you loved this post, share it with your friends and don’t forget to subscribe to the blog (mostly 1 article per week) or Twitter along with the 7000+ awesome people. Look out for some fresh, super interesting investment insights delivered straight to your inbox.
You can also check out my other articles here
Disclaimer: All blog posts are my personal views and do not reflect the views of my organization. I do not provide any investment advisory service via this blog. No content on this blog should be construed to be investment advice. You should consult a qualified financial advisor prior to making any actual investment or trading decisions. All information is a point of view, and is for educational and informational use only. The author accepts no liability for any interpretation of articles or comments on this blog being used for actual investments.

Nice article Arun, I have one doubt regarding an increase in interest rate.
You mentioned that increase in interest rates would increase the YTM from next month to the respective %, but wouldn’t the papers funds are holding would generate same returns/YTM till maturity? So YTM should be same for the existing papers but yes would increase if they buy fresh papers? Corrent me if I am wrong.
Thanks,
Darshan.
LikeLike
Since the NAV gets adjusted (mark to market) for change in yields, the YTM will increase or decrease for the the new NAV value
LikeLike