
Two Accidents of My Life
I had 2 major accidents in the past.
One was during my college second year. Back then, I believed in two simple rules:
- Accidents happen to others
- Always drive fast
One fine day, I realized – ‘Sometimes, these rules don’t work!’
I ended up in a hospital with severe bruises. It was the usual story – rash bike driving, sudden swerve from a random car, lost control, went sprawling on the road along with the bike for few meters…blah blah
Post this, if you haven’t guessed yet, I updated my rules.
- Accidents can happen to me
- Always drive safe
Yet another fine day two years back..
I was driving slow and steady. Suddenly a dog ran out of nowhere into my bike wheels. Rehash of same old story. Only difference. Bruises far worse than the last time.
I realized something.
Sometimes, even the new rules don’t work!
But what in the world, does this have to do with investing?
First time I took excessive risks, the outcome – ACCIDENT.
The second time I had my speed (risk) in control. The outcome – ACCIDENT
Does that mean I was better off over speeding?
This taught me a very important lesson on risk – the concept of odds (probability)
In the first case the probability of me meeting with an accident was very high. If I drove in the same rash manner for these many years, I would have ended up with a lot more accidents.
In the second case, the probability of me meeting with an accident was very low. But the key point is, it is never ZERO. There is always a small chance that I will meet with an accident despite controlling my speed (risk).
Thus there are two forms of risk
- Controllable Risk – Risks which can be controlled – My rash driving
- Uncontrollable Risk – Risks which cannot be controlled – the dog
Life and investing finally boils down to managing the controllable risks. Uncontrollable risks are low probability events which we cannot avoid completely.
With this basic understanding, let us delve into another important question..
How do we improve an Investment Framework?
An investment framework’s primary objective is to control risk. But not all risk can be controlled. An investment framework can only help us reduce the controllable risks.
All frameworks will have to be evolved over time based on feedback from outcomes.
But here comes the nuance. We also need to put outcomes in context just like my accident – with respect to 1)Controllable Risk and 2)Uncontrollable Risks
Keeping this in mind let us revisit my asset allocation framework.
Revisiting My Asset Allocation Framework
Thankfully my investment frameworks have kept me out of a lot of trouble in the last few years. You can read about how they helped me move out of mid caps and avoid credit risk funds.
- Seat Belts, Condoms and the Indian Investor (Link)
- Debt Funds – Revisiting the framework (Link)
- Franklin India Ultra Short Bond Fund – Lessons on Risk and Returns (Link)
I also had shared with you an important framework for taking asset allocation calls here.
But wait a second, what does an asset allocation framework actually tell me?
Once you decide on your base asset allocation say 50% Equity : 50% Debt, the simplest approach is to keep re-balancing this back to the same allocation every year or whenever there is a deviation above a particular threshold (say 5%).
This automatically ensures you add equities when they go down and reduce equities when they rally in a disciplined manner.
While this works great, you can improve on this by reducing equity allocation far below the base allocation of 50% when equities become very expensive and vice versa.
This is called tactical asset allocation.
But how do you know when to reduce and when to increase equity allocation?
This is where our Asset Allocation Framework comes into play.
Equity markets move in cycles. There are 4 phases in a cycle
- Bull – Stay with original allocation
- Bubble – Reduce Equity allocation
- Burst – No action
- Deep Value – Increase Equity allocation
The reason why I built the Asset Allocation framework is to gauge the current phase of equity markets and adjust equity allocation accordingly.
While building any asset allocation framework, it is critical to understand that these are not precise timing tools and can only reduce controllable risks.
As any model can’t precisely time, you may either move out of a bull run a lot earlier missing a lot of the final rally or enter back a lot earlier in a bear market taking a lot of the final decline.
You have to choose between two regrets –
- Regret of missing out a rally
- Regret of not getting our early before a crash
Given my belief that equities will do well over the long run and 70% of the times it will be in an up move, I will rather live with the regret of staying for too late.
This is a personal choice and based on this, the asset allocation model’s interpretation and action points should be defined
Did the model reduce equity allocation before the current COVID-19 crash?
No. The model was still suggesting a neutral weightage i.e sticking to your base asset allocation. (in our example the 50% equity allocation)
Going by the outcome, the model was wrong or to be honest with you – I was wrong!
Now with my ego out of the way, assuming if I could time travel back to Jan-20, before the arrival of Covid-19, how different should have been my decision making?
Reviewing the Asset Allocation Model in Jan-20
I run the model every month, and let us see what it showed me in Jan-20.
I use the below framework to evaluate the asset allocation decisions.
I try to identify the context of valuations along with the where we are in the earnings cycle – based on which the overweight/neutral/underweight positions are decided.

To get a context on the earnings growth cycle and valuations, my model uses seven different lens.
- Valuations
- Earnings Growth
- Cycle – Credit Growth, Capacity Utilisation
- Sentiment
- Interest Rates
- Other Dynamic Asset Allocation Models
- Momentum
Earnings Growth as measured by PAT/GDP, ROE, Past 5 year earnings growth – were all pointing towards a possible bottom of the cycle. I was also taking a call that the worst of NPA cycle was behind us and Banks (especially corporate banks) provide significant earnings kicker given their low base. The recent corporate tax cuts added to the conviction. Low Capacity Utilisation levels and gradual signs of pick up in Credit Growth were indicating a possible bottom of the earnings cycle.
View 1 – While I had no clue when the earnings growth cycle will turn, all indicators were pointing at the bottom of earnings cycle
This meant I was in the 1st column of the framework table.
Now coming to valuations, here is a table which shows the valuations and also the 2008 peak valuations for context.

As seen above, except for PE ratio all other valuation metrics (PB, Market Cap to GDP) were slightly above average but nowhere close to insane valuation levels. While PE ratio was high, I also needed to keep in mind the abnormally low earnings base.
Most dynamic asset allocation funds (also called the balanced advantage funds) were predominantly run based on valuation models. These were at sub 50% levels indicating the same view that valuations were expensive but not insanely expensive.
View 2 – So overall my view was that valuations, were expensive indicating a bull market but were not an insane levels of a Bubble market.
Along with this I also check for other indicators of a bubble –
- Domestic and FII flows – Domestic Flows and FII flows were strong – usually a negative indicator – meaning a polarized view was getting formed
- No IPO frenzy – Positive
- No major theme based mutual fund launches – Positive
- Past 5 year equity returns were not great – Positive
- Momentum was positive
- Mid and Small caps were already in a bear market – Positive
- Interest rates were low and expected to decline further – Positive
So putting all the above together, I took the view that
- Earnings Growth Cycle – Bottom of the cycle
- Valuations – Expensive
Hence Neutral weight on Equities
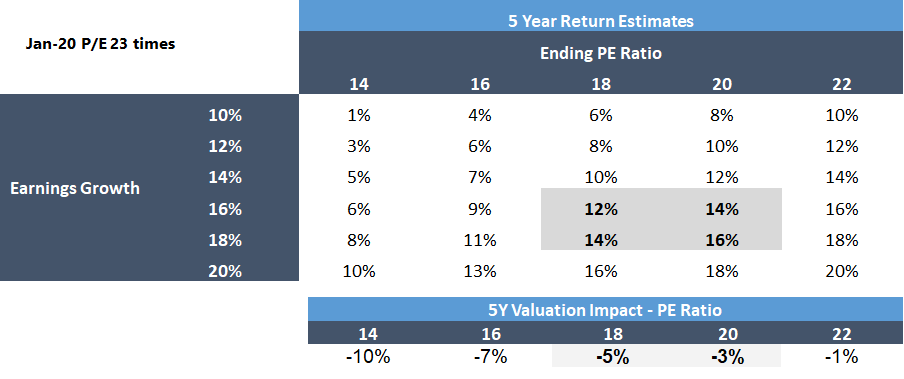
Putting this into an expected return framework for the next 5 years, I was expecting around 12-16% returns from equities accounting for
1. 5Y Earnings growth around 16-18% (given the paltry previous 5 years earnings growth and assuming mean reversion get back to long term 10 year averages)
2. PE Valuation coming down to long term averages of 18-20 – indicating 3-5% CAGR detraction from earnings growth
3. Dividend Yield of around 1.5%
What to Change?
Now with the perspective of hindsight, if I had ignored earnings cycle and only used a valuation framework, the model would have worked. But the last 10 years in US shows that only going by valuations will mean missing out a large part of the rally – a regret I didn’t want my model to capture.
In fact, this was the reason I moved from a pure valuations based model to a 2 factor model some 5-6 years back.
In all previous crisis, the problem mostly starts in the financial sector and then trickles down to real economy. So the bubble is gradually formed and usually get captured in some of the above metrics or other indicators. Similar to my rash driving, there are several indicators which crop up.
But this virus technically could have hit us anytime – like the dog which ran into my bike. It could have hit us in 2009 just during the recovery, 2013 when valuations were cheap or any time possible. No indicator could have caught this.
Let us hypothetically assume the markets become super cheap and all the models become overweight equities and a new virus hits. What do we do?
The more I think of it, I guess this will always remain an uncontrollable risk.
So while my model was not able to predict this correction and I was wrong, I think even if I were to handle the same situation again, I would have stuck with the same decisions – i.e neutral on equities.
Summing it up
The best part of having frameworks and documenting decisions is that it lets you go back, think though and improve on them. The current market fall has been a significant learning for me in terms of understanding 1)Controllable and 2)Uncontrollable risks.
The idea of sharing this framework is not to indicate that this is the right framework. But rather to take you through the thought process and expose myself to feedback. You can build your own framework based on this learning and your own risk preferences.
While it is easier to judge based on investment outcomes, it is very important to put the outcomes in context. Understanding and evaluating the underlying though process is the key for building a replicable and successful investment process.
Happy Investing as always folks!
If you have any thoughts or would want to connect you can mail me at rarun86@gmail.com.
If you loved this post, share it with your friends and don’t forget to subscribe to the blog (mostly 1 article per week) or Twitter along with the 7000+ awesome people. Look out for some fresh, super interesting investment insights delivered straight to your inbox.
You can also check out my other articles here
Disclaimer: All blog posts are my personal views and do not reflect the views of my organization. I do not provide any investment advisory service via this blog. No content on this blog should be construed to be investment advice. You should consult a qualified financial advisor prior to making any actual investment or trading decisions. All information is a point of view, and is for educational and informational use only. The author accepts no liability for any interpretation of articles or comments on this blog being used for actual investments.

One of the best article read in recent times. Arun, would you be able to share what’s your valuation model say now? Is it neutral today? Also, if you could share or update or revisit this article again with new valuation data would be great.
Thanks a lot and keep up the good work in educating us!
LikeLike
Thanks for the great article Arun. In case some one is find it difficult to timely execute an Asset Allocation Framework as we discussed above, do you see any reservations around having a long term goal portfolio(10+ years) comprising of only balanced advantage funds, any downside of the same? I had the same question after reading other article (https://eightytwentyinvestor.com/2019/02/19/you-got-a-large-amount-to-invest-heres-everything-you-need-to-know/)
Pls suggest.
Thanks
Nikhil
LikeLike
Thanks Nikhil. A portfolio with only BAF products is also a great option. The long term returns will be better than debt and slightly lower than equities.
LikeLike