
Japanese rail workers and their strange ritual..
A sleek Japanese bullet train glides noiselessly into the station. Then the strange ritual begins.
During the brief stop, the train conductor in the last carriage suddenly jumps out and starts talking to himself. He points at different parts of the train, station and comments something loud.
See this for yourself..
What in the world is he doing?
The Japanese call this technique, Shisa Kanko, a Japanese phrase meaning ‘point with finger and call’. This is an error-prevention drill that Japanese railway employees have been using for more than 100 years.
The basic problem which the Japanese railways faced was that most of the accidents were caused due to human lapse of concentration and negligence rather than lack of knowledge.
Now, when you ask the rail worker to physically point at things and then name them out loud, he is forced to engage different senses via the brain, the eye, the hand, the mouth and the ears.
This makes him more conscious, aware and alert, thereby significantly reducing the possibility of unintended errors.
Studies have shown that this technique reduces human error by as much as 85 percent.
But aren’t we a lot more smarter and attentive?
Where is the gorilla?
Answer the questions in this video before you move one (it will just take 2 minutes)
As seen in the video above, all of us have our blind spots depending on where we have our focus.
Inevitably in an information overload world, the media has a significant say on where they want us to focus our attention.
As investors, this is not great for us as we get carried away by the news, focus on the wrong things and lose the actual big picture, leading to flawed decision making.
Better decision making starts with frameworks
Now all of us are sure of one thing – this is a bull market.
And yet another thing we are sure of – it will inevitably end someday in the future.
Historically we usually get to see 1 or 2 bear markets every 10 years. This means another 3-6 bear markets in the next 30 years.
In other words, we don’t get too many opportunities to learn how to handle bull market peaks and the bear markets that follow.
While we may read a lot on how to identify bull market peaks and behave during a bear market, nothing beats actually experiencing it and learning from it.
The good part is, we will have this opportunity soon (how soon is anyone’s guess). So, the key for us is to not let go of this great learning opportunity!
Now I honestly haven’t seen a full fledged bear market before. So while theoretically I should be fine, I am really not sure how I will actually handle a bear market.
What do we do about this?
I have a suggestion. Let us develop a framework to evaluate the risk in markets. Something via which we would get a sense of when we need to go slow on equities and when we should go all in into equities.
Now this does two things for us:
If it works, great! We have a framework which we all can use and have a far better investing experience.
If it doesn’t work, first blame me and later we can can always go back and check as to what went wrong and improve our framework
Instead of going blind into the final phase of a bull market, let us be prepared with a framework which can be evolved based on feedback.
Now let me be clear on one thing – the idea of the framework is not about precision – it’s just a disciplined way to get an approximate sense of which part of the market cycle are we in.
I may be wrong. But the idea is to quickly learn, improve the framework, and share the learnings so that everyone can benefit.
So let us check out the framework
Equity market evaluation framework
To evaluate equity markets I use the below 7 factors
- Valuations
- Earnings Growth
- Cycle – Credit Growth, Capacity Utilisation
- Sentiment
- Interest Rates
- Other Dynamic Asset Allocation Models
- Momentum
To ensure that we do not miss out on any of these factors, we shall use the “point and call” Japanese concept for each and every one of the above 7 factors.
The basic starting point will be to have a rough expectation of the long returns i.e 5-7 year returns.
Returns from equity = Change in earnings + Change in PE valuations + Dividend Yield
So basically predicting equity returns boils down to answering these two questions
- What can be the earnings growth?
- Will the valuations move up (increasing returns) or move down (reducing returns) or stay flat (not contributing to returns)
1.Valuation
For valuation I will stick to 3 metrics –
Primary metric
- PE Ratio
Secondary metric (will be used as a support to the primary metric)
- PB Ratio
- MCAP/GDP
PE Ratio:
To understand how valuations impact overall returns you can refer here.

As seen above, the Sensex is currently at a PE ratio of around 23.3 times which is well above (around 30% above) the long term average.
You can also clearly see that Sensex valuations have usually moved between high and low valuations and eventually revert back to the average.
So if we have a 5-7 year time frame and we are getting in now, our returns will improve over and above the earnings growth if the valuations at which we exit is above today’s valuation i.e above 23 times. If it is lower, then our returns will be lower than the earnings growth.
So how do we know the exit valuations?
Back to data as always
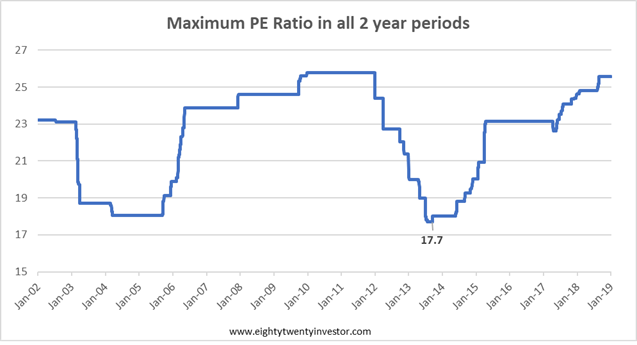
This is an interesting chart and hence let us take some time to understand.
I have plotted the maximum PE ratio of Sensex for each and every 2 year period since 2000 till 2018.
In other words this was the best valuation multiple you got, to exit over a two year period.
The interesting part is historically, you always got a chance to exit at a PE multiple of above 17!
Now while there is nothing sacrosanct about this number and the future might be different, it gives us a good starting point to think of exit multiples based on history.
It simply means, if history holds true, I have a high possibility of exiting atleast at a PE multiple 17 times (and higher than that if I have luck by my side).
So we can have a rule that states,
Post the 5th year (assuming your goal is 7 years away), you exit the moment PE multiple is above 17 times.
This implies your exit valuation multiple in the worst case will be 17 times. In the current context, from our starting multiple of 23.3 it is a drag of 37% or 6.5% per year from earnings growth.
If you assume average of 18 times as your exit multiple then it implies a absolute drag of 30% or 5% per year from earnings growth.
Pointing and Calling on PE Valuation: PE ratio implies a possible drag of 5-6% from earnings growth
Let us also check what the other metrics indicate
Price to Book Value
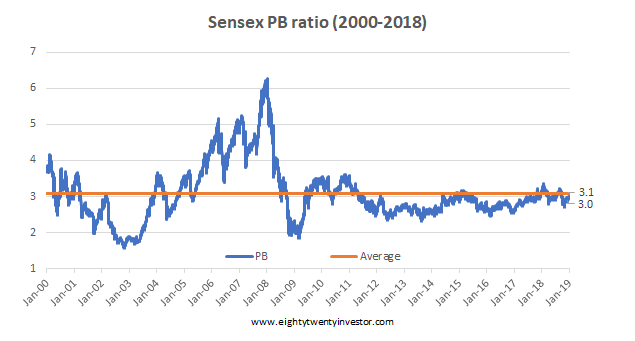
When you look at it from a Price to Book point of view, then the valuations look reasonable as they are close to their long term average.
But why this deviation between PE and PB?
PB = PE * Return On Equity
As seen from the above equation, the culprit for this difference in signals from PE and PB valuations is because of ROE. The ROE for Indian equities is extremely low at this juncture.
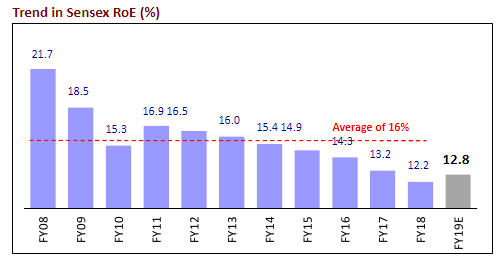
ROE usually tends to mean revert over time. We need to keep this context in mind while evaluating PE valuations which look expensive
Pointing and Calling on PB Valuation: PB ratio is reasonable. Low ROE leading to expensive PE valuation.
MCAP to GDP
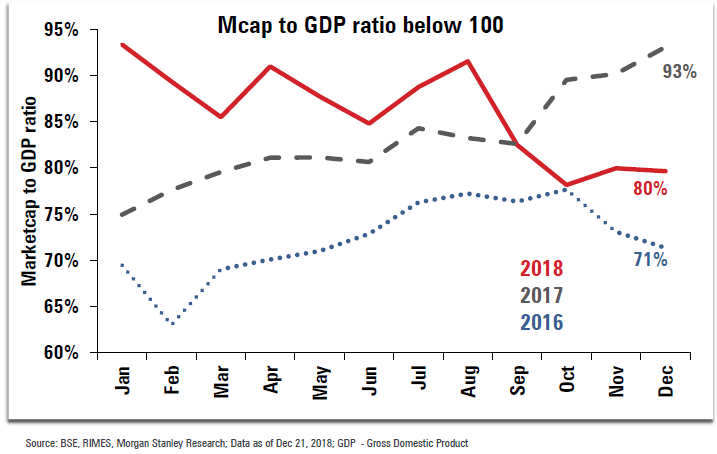
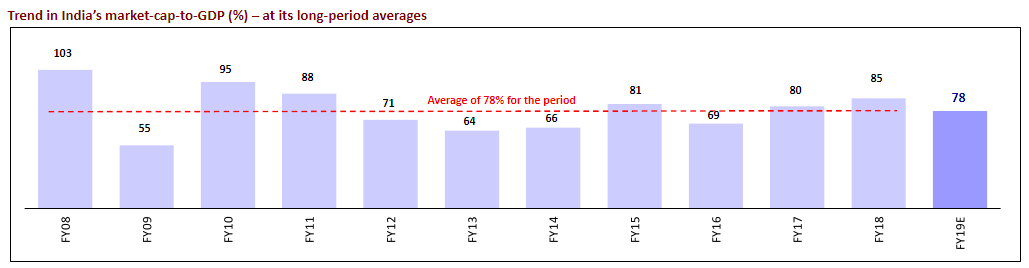
The current MCAP/GDP is close to historical average
Pointing and Calling on MCAP/GDP Valuation: MCAP/GDP indicates reasonable valuations
2.Earnings Growth
Anyone who has tracked analysts prediction for earnings growth in the last 5 years know one thing for sure – it is damn difficult to get it right.
So while I profess no superior powers to forecast, taking a longer time frame of say 5-7 years, provides us with a slightly better chance to project earnings growth. (Of course, this can be wrong. But hey, we need to start somewhere right!)
Just like we used mean reversion as our base case in valuations, we shall use mean reversion in Corporate Profits to GDP as our base case to project earnings growth for the next 5-7 years. A longer time frame means we are providing more time and hence a higher likelihood of mean reversion happening.
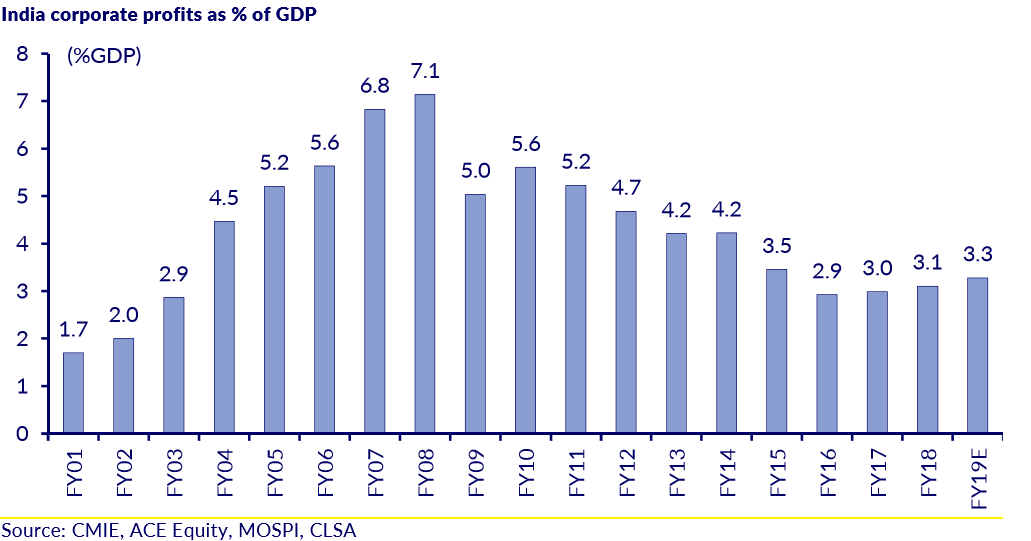
A lot of reports come up with corporate profits as a % of GDP. While different reports have different numbers, the overall number is very close to each other. I have taken CLSA’s data. (Source: Link)
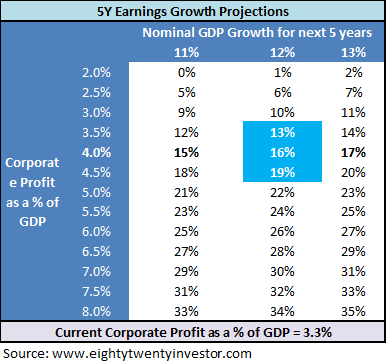
The average corporate profits as a % of GDP since 2001 is 4.2%. Currently for FY19 it is expected to be 3.3%.
Now assuming mean reversion to around 3.5% to 4.5% and a nominal GDP growth of around 11% (6% real growth + 5% Inflation) we end up with a profit growth range of 12% to 18%.
Pointing and Calling on Earnings Growth: Profit Growth Expectation for the next 5 years: 12% to 18%
5 Year Equity Return Estimates
Applying these numbers to our original equation:
Returns from equity = Change in earnings + Change in PE valuations + Dividend Yield
Change in earnings = 12% to 18%
Change in PE valuations = -5%
Dividend Yield = 1% to 1.5%
Pointing and Calling on future equity return expectations: Approximate estimate of equity returns over the next 5 years: 8% to 14%.
Assuming an inflation of 5%, that is a real return of around 3% to 9% which is pretty decent!
3.Cycle – Credit Growth, Capacity Utilisation
Credit growth has started to pick up
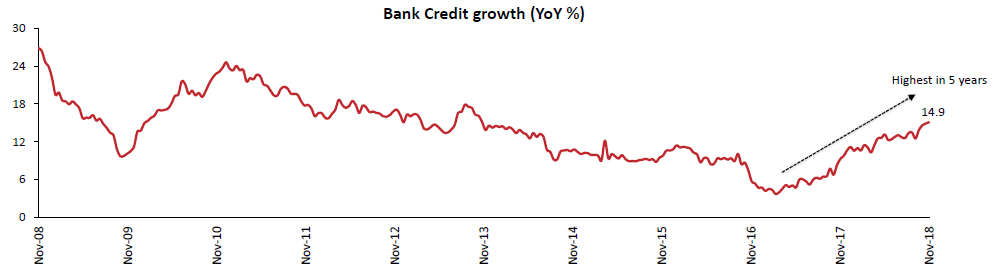
Capacity Utilisation is increasing – early stages of a capex cycle
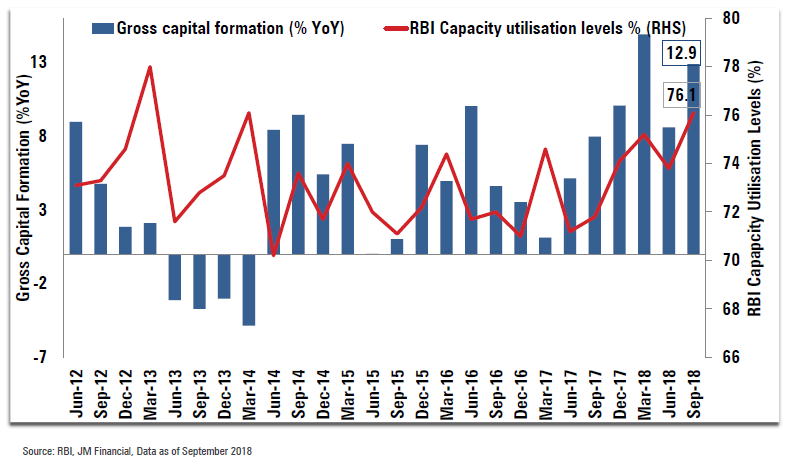
Pointing and Calling on Capacity Utilisation & Credit Growth: Earnings growth can receive support from: improving credit growth and capacity utilization (possibility of capex cycle picking up)
4. Sentiment
A good way to measure sentiment is use FII, DII and MF Flows into Indian equities.
FII Flows
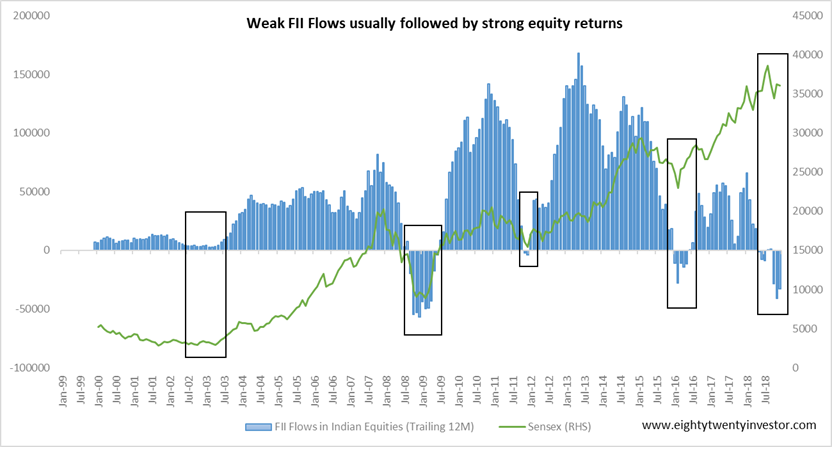
Foreign investors have been structurally positive on India. So while there are short term instances where they took out money, they have always returned back. So whenever FII flows were negative, it was a great time to invest in Indian equities.
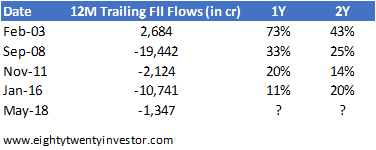
Now currently the FII flows for the last 12 months are negative!
Pointing and Calling on FII Flows: Negative FII flows usually indicate strong 2 year returns
DII Flows

DII flows have been very strong in the past few years which is also supporting the higher valuations. But a large chunk of the money came during 2017, which means for those investors the returns would be dismal (more dismal if it went to mid and small cap segment). So we need to monitor the DII flows very carefully.
It is currently supported by strong equity MF flows and SIP culture.

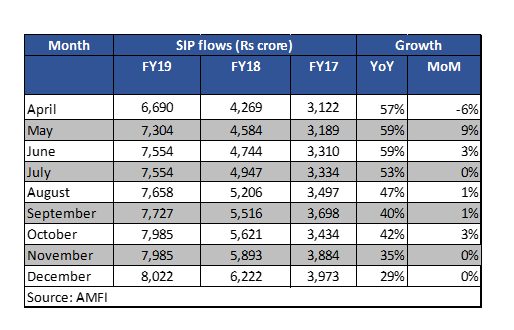
Pointing and Calling on DII Flows: Strong DII flows (primarily from MFs + SIP culture) were supporting higher equity valuations. However, early signs of fatigue visible. Needs to be monitored.
5.Interest Rate
- Current Inflation
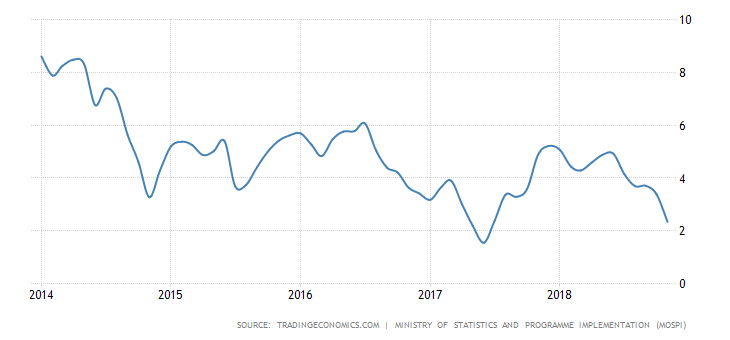
- RBI Projection
Inflation is projected at 2.7-3.2 per cent in H2:2018-19 and 3.8-4.2 per cent in H1:2019-20, with risks tilted to the upside.
Source: RBI Monetary Policy date 05-Dec-2018
The good part is Inflation is expected to stay below 5% according to RBI. This implies lower interest rates.
Pointing and Calling on Interest Rates: Lower Inflation + Interest rates may lend support to equity valuations
6.Other Dynamic Asset Allocation Models
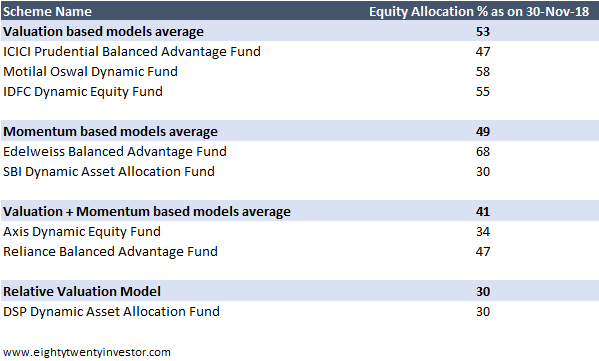
Pointing and Calling on other Asset Allocation Models: Majority of models indicate a not-so-positive stance on equities
7.Momentum & Trend
Absolute Momentum:
3M Return: 2%
6M Return: 0%
1Y Return : 6
Trend:
50 Day Moving Average : 2%
100 Day Moving Average : -1%
200 Day Moving Average : : 2%
Pointing and Calling on Momentum & Trend: Momentum & Trend is Positive
Putting it all together:
Phew. Now let us put all this together and make some sense
- Valuations: PE ratio implies a possible drag of 5-6% from earnings growth
- Earnings Growth: Corporate Profits to GDP well below historical average. Possible Mean reversion indicates 12-18% earnings growth environment
- 5Y Equity Return Expectation: 8% to 14%
- 5Y Equity Real return Expectations: 3% to 9%
- Cycle – Credit Growth, Capacity Utilisation: Earnings growth to be supported by: improving credit growth and increasing capacity utilization (possibility of capex cycle picking up)
- Sentiment: Negative FII Flows indicate strong returns in the next 2 years. High valuations were supported by strong DII Flows (primarily from mutual funds and new SIP culture). But early signs of fatigue in DII flows – needs to be monitored
- Interest Rates: Lower Inflation + Interest rates may lend support to equity valuations
- Other Dynamic Asset Allocation Models: All models indicate a not-so-positive stance on equities (due to higher valuations)
- Momentum & Trend: Both are positive
We can classify markets into 4 cycles: Bust, Best, Boom, Bubble (borrowed from this interview of ICICI Prudential Sankaran Naren’s framework here)
All these indicators put together, indicate that we are not in a bubble zone. The valuations indicate that we are neither in the Best zone. While mid and small caps have seen a partial bust, overall the markets in my opinion are still in the Boom zone as the earnings growth is yet to pick up and the start of earnings growth might lead to decent returns.
So for those who are investing now different combinations of Multicap funds and Dynamic Asset Allocation funds can be a good option to build portfolios.
Given the early signs of fatigue in DII flows, I am still a little worried on going for mid and small caps directly and rather would play them through multicap funds.
This is an evolving framework and I hope to update it every 6 months. Remember I can be wrong (most often I will be). The whole idea about documenting and sharing the framework is to create discipline, to stay humble and to take feedback both from you and markets to improve this framework.
If you feel there can be areas that can be improved, views that you don’t agree with or factors that can be added do let me know either via the comments or by mailing me at rarun86@gmail.com.
Happy investing as always!
If you loved this post, do share it with your friends and don’t forget to subscribe to the blog via Email (1 article per week) or Twitter along with the 5000+ awesome people. Look out for some fresh, super interesting investment insights delivered straight to your inbox.
If in case you have any feedback or need any help regarding your investments or want me to write about something, feel free to get in touch at rarun86@gmail.com
You can also check out my other articles here
Disclaimer: All blog posts are my personal views and do not reflect the views of my organization. I do not provide any investment advisory service via this blog. No content on this blog should be construed to be investment advice. You should consult a qualified financial advisor prior to making any actual investment or trading decisions. All information is a point of view, and is for educational and informational use only. The author accepts no liability for any interpretation of articles or comments on this blog being used for actual investments.

The link for RBI Policy document is broken 🙂
LikeLike
Apologies Bhargav. Rectified!
LikeLike
no worries, just a heads up 😀
LikeLike
It essentially reflects that there are macro factors (like Interest rate cycle, Economy cycle, Market sentiment, Momentum and trends and Dynamic Asset Allocation Models) and micro factors (like Valuations, Earning Growth, and Return Expectation). Even Earnings Growth as a factor if taken for the market as a whole like Corporate Profit as a % of GDP also falls under ‘macro factors’. It essentially means that all those factors over which individual company has little ‘control’, should be counted as ‘macro factors’.
It is a good framework to start with.
In my opinion, giving all 7 or 9 factors “equal weight” in the model may not be right here. Like “Dynamic Asset Allocation Models” and “momentum and trends” are basically outcomes of Interest rate and Economy cycle and broader Market Sentiment.
Do HUL, Nestle, et al perform ‘very badly’ in a bad sentiment, momentum and economic performance market period. I don’t think so.
So, individual company’s performance should have at least equal weight or may be even slightly more weightage (say, minimum 50% to a maximum of 55%) and macro factors should hold roughly 45 to 50% weightage in this model.
These are just initial thoughts as I was reading the article.
But very interesting. The challenge would be develop it, give weightage, institutionalize and develop it while running it to see how it works.
LikeLike
Thanks Kamal. The idea of giving 50% weightage to equity stock portfolio is something which can be explored. I primarily use earnings growth, valuations, sentiment and momentum to build asset allocation models. Maybe will explain in a future post
LikeLike
Very interesting article. The challenge in predicting the macro economic condition and market direction based on a few key financial ratios will be next to impossible. As there are many more factors at play, whether it is geopolitical, weather, elections and possibly hundred other things.
But history does repeat it itself and the reversion to the mean is bound to happen, when and what causes it, is what eludes us.
Happy investing.
LikeLike
A very honest & sincere attempt. Appreciate!
LikeLike
Thanks Dilip 🙂
LikeLike