
Out of all the asset classes, Gold is the most difficult one to understand. This is primarily because Gold doesn’t provide an underlying cash flow like the other asset classes ( Dividends in Equity, Interest payment in FD and Fixed Income, Rent in Real estate). Hence valuing gold is extremely difficult.
However Gold for several centuries has been perceived to be a store of value and as long as the perception remains, investing in gold should work fine. So for the purpose of investing, we will evaluate gold as a currency.
When we in India invest in Gold, there are two factors which determine our returns.
- The global price of Gold which is denominated in US Dollar
- The exchange rate: USD-INR
Gold price in India = Gold price is USD * USDINR
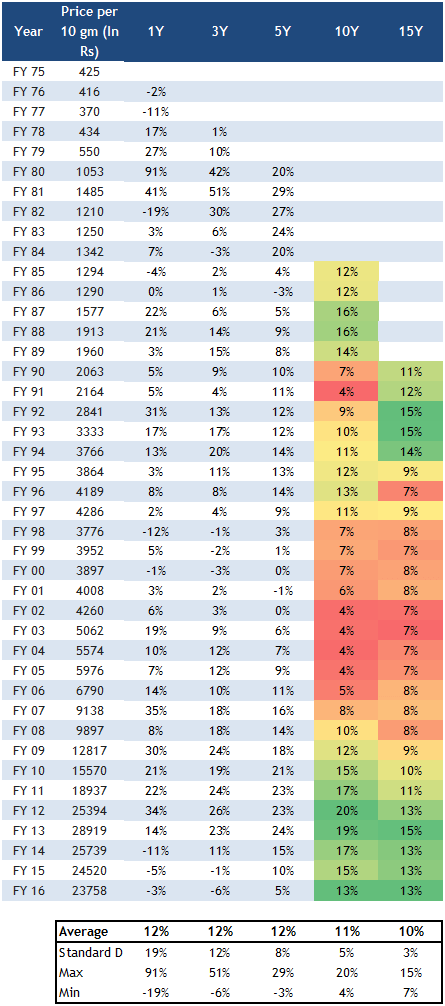
The average gold returns over a 10 year period has been ~10 to 11%. But hold on. As seen below, averages also hide a lot of the underlying periods where returns have been significantly low (4% annualized returns between 1992-2002) and significantly high (20% between 2002 to 2012).

Source: RBI
Hence it is extremely important not to get carried away by the returns of the recent years. Instead of being fixated by a single average return number, our expectations of return from gold for the next 10 years going by history should be anywhere between 4 to 20%.
We also realised that Gold returns are contributed by the change in actual gold prices in USD and the change in USD INR. So let us further investigate and figure out what was the contribution of actual gold prices and the currency for gold returns in INR.
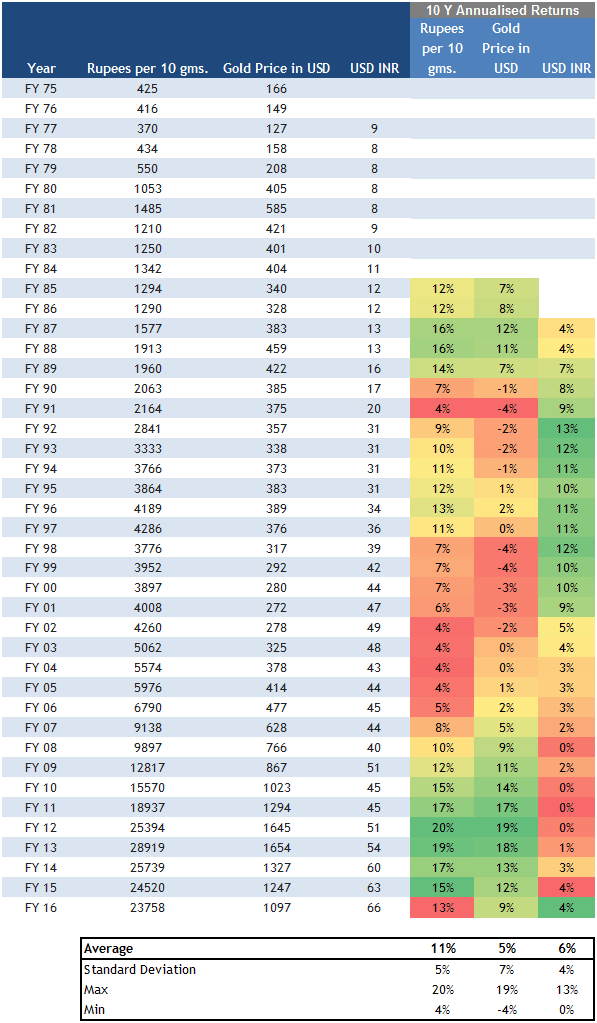
As seen above the periods between FY81 to FY06 were characterized by low actual gold returns – 585 USD per ounce in FY81 to 477 USD per ounce in FY06 . However for Indians, the Rupee weakening came to the rescue as USD INR moved from INR 8 per dollar in FY 81 to INR 45 in FY06
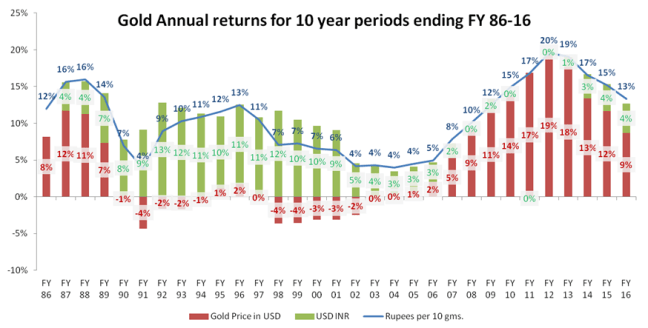
For investors who invested in Gold post FY 99 the returns were primarily driven by the rally in actual Gold prices(USD) from USD 292 per ounce in FY99 to USD 1654 per ounce in FY13. The USD-INR for the same period moved from INR 42 per dollar to INR 54 per dollar
- Gold returns have been in a range of around 4 to 20% historically
- The returns will be a factor of a) the actual change in gold prices (USD) b) change in currency – USD-INR
But the real question that matters to us what will happens to gold returns in the next ten years.
Hang on..This post is getting a bit too long ..so I will do a separate post on that next week..

Flash forward to today. Are bullions including silver and not jewellery still a good investment?
LikeLike